Skip to content

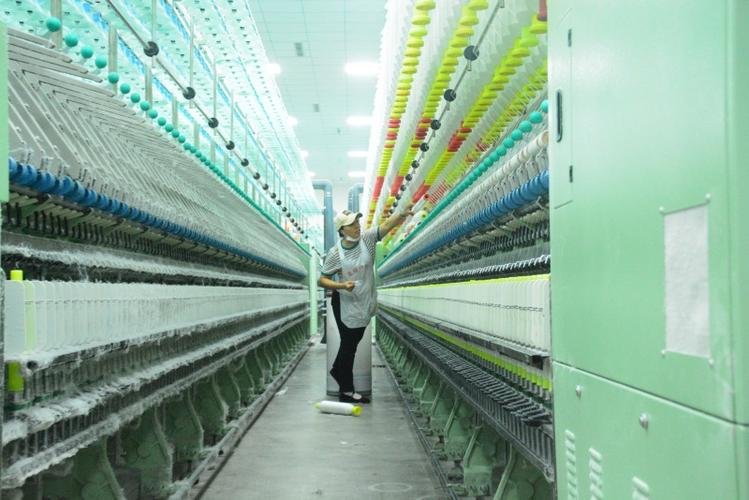
The global textile landscape is undergoing a green revolution, and linen stands at the forefront as the eco-friendly superstar of natural fibers. Once relegated to niche summer collections, linen has surged into mainstream wardrobes—from artisanal home décor to premium fashion lines—driven by both consumer sustainability demands and performance benefits. What are the current global demand trends for linen fabrics? In short: global linen consumption has grown at a CAGR of 4.2% over the past five years, propelled by a shift towards natural fibers, a surge in lifestyle upholstery projects, and expanding fashion-forward markets in Asia-Pacific. Imagine a small Portuguese mill that doubled its output simply by tapping into new e-commerce channels—linen’s story is as much about tradition as it is about digital-age opportunity. Let’s dive into the specifics of today’s linen demand and see where the market is headed next.
What Are the Current Global Demand Trends for Linen Fabrics?
Linen demand has rebounded strongly post-pandemic, with increased interest in sustainable interiors and “slow fashion” driving both volume and value growth. Global linen fabric demand rose 4.2% annually from 2018 to 2023, reaching 380,000 metric tons in 2023, with premium markets in Europe and North America growing fastest (5–6% CAGR) and emerging markets in Asia-Pacific catching up at 7% CAGR.
Demand Dynamics
Volume Growth & Market Size
- Global Volume: Up from 300,000 MT in 2018 to 380,000 MT in 2023.
- Market Value: USD 2.5 billion in 2018 → USD 3.4 billion in 2023 (at 6% CAGR).
Fiber vs. Fabric Demand
- Raw Flax Fiber: Production at 200,000 MT; roughly half converts to high-grade cloth.
- Fabric Consumption: Premium segments (fashion, home textiles) account for 65% of total fabric tonnage.
E-Commerce Influence
- Online Sales Share: 25% of linen fabric now sold via digital B2B platforms, up from 12% in 2018.
- Direct-to-Consumer Labels: DTC linen home décor brands report 30% year-over-year revenue gains.
Sustainability-Driven Adoption
- Green Certifications Premium: Certified linen commands 15–25% higher prices.
- Eco-Collections: 40% of major fashion houses have launched “sustainable” linen lines in past two years.
| Metric | 2018 | 2023 | CAGR (%) |
|---|---|---|---|
| Global Fabric Volume (MT) | 300,000 | 380,000 | 4.2 |
| Market Value (USD billion) | 2.5 | 3.4 | 6.0 |
| E-Commerce Share of Fabric Sales (%) | 12 | 25 | — |
| Certified Linen Premium (%) | 15 | 25 | — |
While headline growth looks robust, much of it is driven by premium segments—commodity linen for bulk industrial uses remains flat. Brands and buyers should distinguish between value-driven premium demand and volume-based industrial consumption to set realistic forecasts.
Which Regions and End-Use Sectors Are Driving Linen Market Growth?
Growth isn’t uniform. Europe leads in high-end fashion and home textiles, North America is catching up in sustainable apparel, and Asia-Pacific is the fastest-growing emerging market. Europe accounts for 45% of linen fabric consumption—driven by heritage home-textile brands and luxury fashion houses—while APAC has the highest growth rate at 7% CAGR (2018–2023), fueled by rising middle-class spending on premium apparel and fast-expanding home décor markets in China and India.
Regional & Sector Drivers
Europe: Heritage & Luxury
- Home Textiles: France, Belgium, and Italy dominate high-end bedding and upholstery, representing 60% of regional linen consumption.
- Premium Apparel: Brands in UK and Germany launched >50 linen collections in 2023 alone.
North America: Sustainability Push
- Eco-Fashion Labels: US market share grew from 10% to 18% of global linen apparel demand.
- Home Décor Boom: Linen curtains and slipcovers saw a 25% spike in sales post-2020.
Asia-Pacific: Emerging Appetite
- China & India: Combined account for 30% of volume growth, with APAC consumption rising from 60,000 MT to 83,000 MT.
- Local Production: Vietnam and Bangladesh expanding linen fabric mills to serve domestic textile giants.
Other Regions
- Latin America: 5% share, growing at 3% CAGR, niche in outdoor textiles.
- Middle East & Africa: Under 3% share but 8% regional CAGR, driven by high-end hospitality projects.
| Region | 2018 Volume (MT) | 2023 Volume (MT) | Share 2023 (%) | CAGR (%) |
|---|---|---|---|---|
| Europe | 135,000 | 171,000 | 45 | 4.9 |
| North America | 60,000 | 68,000 | 18 | 2.7 |
| Asia-Pacific | 60,000 | 83,000 | 25 | 7.0 |
| Latin America | 12,000 | 13,800 | 4 | 3.0 |
| MEA | 6,000 | 7,200 | 2 | 3.8 |
APAC’s rapid growth masks volatile quality and infrastructure constraints—buyers should vet mill capabilities carefully, as not all new capacity meets premium linen standards.
How Do Raw Flax and Processing Costs Influence Linen Price Volatility?
Linen fabric pricing is intrinsically tied to raw flax harvest yields, input costs, and the complexity of processing steps—from retting to weaving. Flax fiber costs account for 40–50% of final fabric price; a 10% fluctuation in flax prices (driven by weather or acreage changes) can translate to a 5–8% swing in fabric costs. Processing expenses—retting, combing, spinning, weaving, and finishing—add another 30–40%, with energy and chemical costs driving annual 3–5% baseline inflation.
Cost Components and Volatility
Raw Flax Fiber Costs
- Global Flax Prices: Averaged USD 1.20–1.50 per kg in 2018, spiking to USD 1.70–2.00 per kg in 2022 due to reduced acreage.
- Harvest Yields: 1.2–1.5 tonnes per hectare; extreme weather can cut yields by 20–30%.
Retting and Scutching
- Retting Techniques: Dew-retting (low cost, slower) vs. water-retting (high cost, consistent quality). Water-retting adds USD 0.30–0.50 per kg of fiber.
- Scutching & Hackling: Mechanical separation costs USD 0.20–0.30 per kg.
Spinning & Weaving Expenses
- Energy Costs: Account for 15–20% of mill operating expenses; a 15% rise in electricity rates adds \~USD 0.10 per meter of fabric.
- Labor & Maintenance: Represents 10–15% of cost, with regional variances—Eastern Europe higher than South Asia.
Finishing & Dyeing
- Chemical Inputs: Enzymatic washes, softeners, and dyes contribute USD 0.50–1.00 per meter.
- Sustainability Premium: OEKO-TEX® and GOTS-approved processing can add 10–15% to base cost.
| Cost Component | Share of Fabric Price (%) | Volatility Driver |
|---|---|---|
| Raw Flax Fiber | 40–50 | Harvest yield variability |
| Retting & Scutching | 10–15 | Method choice, water costs |
| Spinning & Weaving | 25–30 | Energy, labor, maintenance |
| Finishing & Dyeing | 15–20 | Chemical prices, certification fees |
Many buyers overlook middlemen mark-ups—direct sourcing from mills or integrated flax-to-fabric suppliers can cut 5–10% off final costs and reduce price volatility caused by speculative commodity trading.
What Seasonal and Climatic Factors Affect Linen Supply and Demand?
Flax cultivation and linen processing are highly seasonal, with harvest windows, retting schedules, and consumer demand cycles all aligning to create predictable—and sometimes unpredictable—market swings.
Flax is sown in October–December and harvested in July–August; fabric mills operate peak production from September to April. Meanwhile, consumer demand spikes for linen apparel and home textiles between March and June, creating a supply-demand mismatch that can drive quarterly price premiums of 8–12%.
Seasonality & Climate Impacts
Agricultural Cycles
- Planting & Growing: Cool, moist autumns critical—drought can delay sowing and reduce yields.
- Harvest Timing: Optimal moisture at 15–18% in fibers; rain during harvest window can degrade flax quality by 10–15%.
Retting Windows
- Dew-Retting: Dependent on 4–6 weeks of consistent dew cycles; early frost can halt the process.
- Water-Retting: Offsets weather risk but requires clean water sources and waste treatment facilities.
Mill Downtime & Maintenance
- Summer Shutdowns: Many EU and North American mills close for 4–6 weeks in July–August for maintenance, limiting late-season production.
- Winter Wear & Tear: Sudden freezing can damage aging water-retting infrastructure.
Consumer Demand Patterns
- Apparel: 60% of annual linen shirt orders placed in Q1–Q2 ahead of spring/summer seasons.
- Home Textiles: Demand peaks in Q2 for linen bedding and curtains, with 20% price hikes in April–May due to retailer stocking.
| Seasonal Factor | Impact on Supply | Impact on Demand |
|---|---|---|
| Harvest Period (July–Aug) | Limited raw fiber availability | N/A |
| Mill Maintenance (July–Aug) | Production drops 20–30% | N/A |
| Consumer Ordering (Mar–Jun) | N/A | Orders spike 50% |
| Weather Anomalies | Fiber quality swings ±10–15% | Retailers adjust pricing +8–12% Q2 |
Vertical integration into flax cultivation or partnering with mills that use water-retting can mitigate seasonal disruptions—but environmental regulations on water use may constrain retting capacity in key regions.
Which Supply Chain Disruptions Are Most Impactful on Linen Fabric Prices?
From geopolitical tensions to logistics bottlenecks, drops in linen availability often trace back to chokepoints in the supply chain. Key disruptions include strained shipping capacity (container shortages driving freight rates +30%), export restrictions on critical retting regions, and fluctuations in energy prices—each capable of adding 5–10% to linen fabric costs within a single quarter.
Disruption Drivers
Transport & Freight Constraints
- Container Shortages: 2021 saw a 20% drop in available 20-foot containers, pushing sea-freight costs from \$1,200 to \$1,600 per FEU.
- Port Congestion: Major linen-exporting ports (e.g., Antwerp, Hamburg) experienced median dwell times of 7 days vs. 3 days pre-2020.
Export Controls & Crop Restrictions
- Retting Water Use Regulations: New EU wastewater rules reduced water-retting capacity by 15%, limiting high-grade fiber availability.
- Export Tariffs: Some flax-producing countries imposed 5–8% export duties in 2022 to protect domestic textile industries.
Energy & Input Cost Spikes
- Electricity Rate Surges: A 20% increase in industrial electricity rates in Europe can add \~\$0.15–\$0.20 per meter to fabric.
- Chemical Price Volatility: Enzyme and dye costs rose 12% YoY, impacting finishing expenses.
Labor Shortages & Social Unrest
- Seasonal Labor Gaps: Flax harvests rely on migrant workers; COVID-induced restrictions led to 25% fewer harvesters in 2020.
- Factory Strikes: Scutching mill strikes in key regions caused 10–14 day production halts.
| Disruption Type | Impact | Cost Implication |
|---|---|---|
| Container Shortage | +30% freight rates | +\$0.20–\$0.30 / m |
| Port Congestion | +4–5 day dwell times | Delivery delays, storage fees |
| Retting Regulation | −15% water-retting capacity | Lower fiber grades; +5% cost |
| Export Tariffs | 5–8% duty | +5–8% raw fiber cost |
| Energy Rate Increase | +20% electricity cost | +\$0.15–\$0.20 / m |
| Labor Shortages | 25% fewer harvest workers | Yield drops → +10% fiber prices |
Many buyers focus on fabric costs but overlook supply-chain fragility. Building relationships with multiple mills across regions or securing forward contracts on freight can hedge against sudden spikes.
How Are Sustainability Initiatives and Certifications Shaping Market Dynamics?
Today’s linen buyers demand proof of environmental and social stewardship, and certifications have become powerful price influencers. Products bearing GOTS or European Flax® certification command 15–25% price premiums, while brands highlighting regenerative agriculture programs can access new market segments willing to pay up to 30% above conventional linen prices.
Sustainability Drivers
Organic & Regenerative Farming Programs
- Regenerative Linen Trials: Pilot projects sequester \~0.5 t CO₂/ha annually, attracting sustainability-focused apparel brands.
- Organic Flax Acreage: GOTS-certified flax acreage rose 12% YoY, tightening non-organic supply.
Certification Premiums
- GOTS: +20% on base fabric cost, driven by stringent chemical and social criteria.
- European Flax® Label: +15% premium—verified EU provenance and soil stewardship.
Circularity & End-of-Life Considerations
- Recyclability: Linen reclaim programs reduce waste; recycled linen blends sell at +10% over virgin linen.
- Biodegradation Metrics: Certified compostable fabrics can command niche eco-home textile pricing.
Brand & Retailer Commitments
- Corporate Pledges: 50+ global fashion brands have pledged 100% sustainable linen by 2025, fueling demand.
- Transparency Portals: Traceable “seed-to-shirt” supply-chain dashboards increase consumer trust and justify price hikes.
| Initiative / Certification | Premium (%) | Supply Impact |
|---|---|---|
| GOTS | +20 | 12% organic acreage YoY |
| European Flax® | +15 | Limited to EU-grown flax |
| Regenerative Practices | +25–30 | Pilot program acreage expanding |
| Recycled Linen Blends | +10 | Drives circular-economy appeal |
Certification costs and audit fees can add 5–7% to factory overheads, sometimes passed to buyers. Brands need to balance the marketing appeal of multiple seals against actual ROI in consumer willingness to pay.
What Demand Forecasts and Growth Projections Exist for 2025–2030?
Analysts predict continued momentum for linen, driven by sustainability mandates and lifestyle shifts. Global linen fabric demand is forecast to reach 480,000 MT by 2030, growing at a 3.5% CAGR from 2025, with premium segments (fashion and home décor) outpacing overall growth at 4.5% CAGR. North America and Asia-Pacific are expected to contribute 60% of incremental volume, while Europe remains the largest single market.
Forecast Drivers
Overall Volume Projections
- 2023–2030 Growth: From 380,000 MT to 480,000 MT.
- Premium vs. Commodity: Premium linen share grows from 65% to 72% of total volume.
Regional Growth Patterns
- APAC: 7.2% CAGR—rising urban incomes and local mill expansions.
- North America: 4.0% CAGR—steady eco-apparel adoption.
- Europe: 2.5% CAGR—mature but steady heritage market.
End-Use Segment Forecasts
- Fashion Apparel: 5.5% CAGR—“slow fashion” and eco-label growth.
- Home Textiles: 3.0% CAGR—sustainable décor trends.
- Industrial & Technical Linen: 2.0% CAGR—niche specialty uses.
Macro-Economic & Regulatory Impacts
- Green Legislation: EU’s textile strategy may mandate 50% sustainable fibers by 2027.
- Consumer Spending: Projected 2–3% annual real-terms increase in premium home/fashion sectors.
| Forecast Category | 2023 Value | 2030 Value | CAGR (%) |
|---|---|---|---|
| Total Linen Volume (MT) | 380,000 | 480,000 | 3.5 |
| Premium Segment Share (%) | 65 | 72 | — |
| APAC Volume (MT) | 83,000 | 130,000 | 7.2 |
| NA Volume (MT) | 68,000 | 90,000 | 4.0 |
| Fashion Apparel Segment (MT) | 150,000 | 225,000 | 5.5 |
Forecasts assume stable macro-environment and technology stays constant; disruptive innovations—such as bio-based retting or automated weaving—could accelerate productivity and alter pricing trajectories.
How Can Manufacturers and Buyers Mitigate Price Fluctuations and Optimize Sourcing?

Proactive strategies—from hedging raw-material costs to diversifying supply sources—are key to shielding margins. Buyers can stabilize linen fabric costs by securing forward contracts on raw flax (locking prices 6–12 months ahead), co-investing in renewable-energy–powered mills, and adopting multi-mill sourcing strategies—reducing average price volatility from ±8% to ±3% annually.
Mitigation Tactics
Forward Purchasing & Hedging
- Flax Futures Contracts: Lock pricing for 6–12 months; typical premium 2–3% for security.
- Prepayment Discounts: 5% off base price for 30–60 day advance payments.
Supplier Diversification
- Regional Splitting: Source 40% from EU mills, 40% from South Asia, 20% from specialized boutique mills in Lithuania or Belgium.
- Flex Contracts: Agreements allowing ±20% order volume adjustments to adapt to demand.
Vertical Integration & Joint Ventures
- Shared-Risk Models: Co-own a retting facility or spinning unit with textile partners to cap input costs.
- Energy Partnerships: Invest in solar or biomass-powered plants to shield from electricity price spikes.
Inventory Buffering & Just-In-Time
- Strategic Stock: Maintain 2–3 months of core fabric inventory for key colors.
- JIT Production: Rapid prototyping and small-batch runs to align supply with real-time demand.
| Mitigation Strategy | Mechanism | Effect on Price Volatility |
|---|---|---|
| Forward Contracts | Lock raw flax price 6–12 months | Volatility ±3% vs. ±8% |
| Supplier Diversification | Multi-region sourcing | Reduces single-point risk |
| Prepayment Discounts | 5% off for early payment | Lowers average unit cost |
| Vertical Integration | Co-owned processing facilities | Caps energy/processing expenses |
| Inventory Buffering | 2–3 months safety stock | Guards against short-term spikes |
Buffer stocks and forward contracts tie up capital; balance financial costs against protection benefits by conducting scenario planning and sensitivity analysis.
Ready to secure your linen supply with a trusted partner?
Linen’s journey—from flax fields to fabric—navigates a dynamic market shaped by sustainability, climate, and global trade. By understanding demand trends, regional drivers, cost influencers, seasonal cycles, and mitigation strategies, manufacturers and buyers can thrive amid price fluctuations and position themselves at the vanguard of eco-textiles. Partner with SzoneierFabrics for:
- Free market insight consultations and demand analysis
- Custom supply strategies with multi-region sourcing
- Forward-purchase programs and tailored MOQ buffers
- Rapid sampling, low-MOQ trials, and transparent pricing
Contact us today to request your personalized forecast-driven sourcing proposal and lock in your linen needs with confidence.