Skip to content
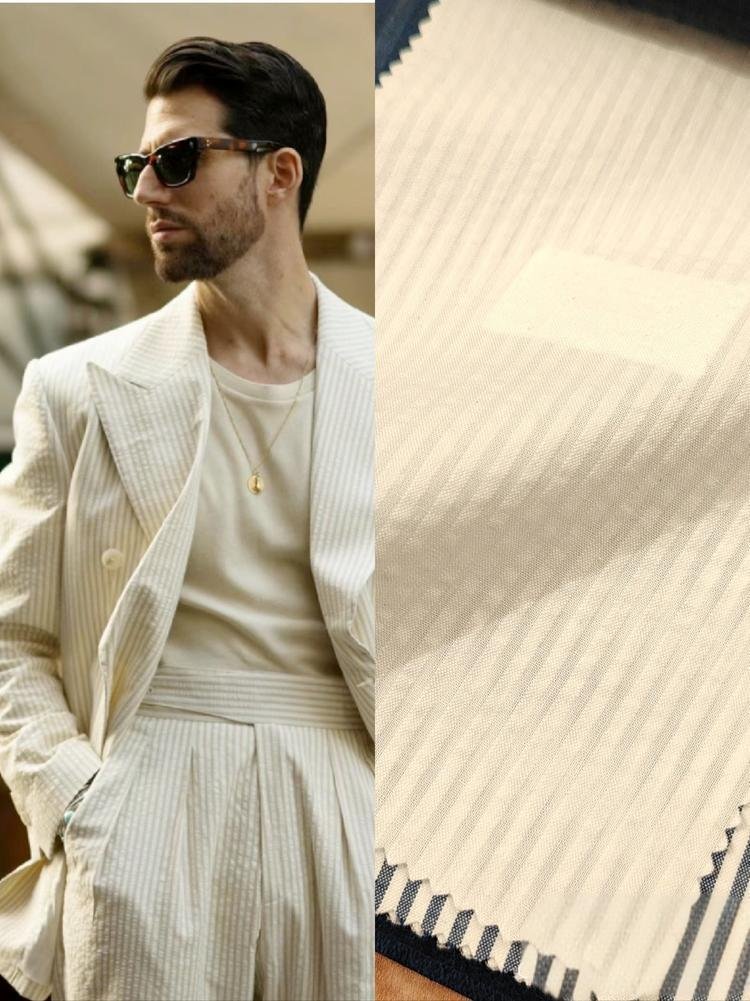
Linen and cotton have each powered global textiles for centuries, yet today’s brands face a pivotal decision: which fabric delivers the optimal balance of cost, performance, and brand narrative? linen commands a 15–30% price premium over cotton due to higher raw-material costs and more complex processing, yet it outperforms cotton in durability, moisture wicking, and eco-credentials—making it a strategic choice for premium lines. Imagine your summer collection marketed on “effortless natural luxury,” only to have cotton pieces fade and pill within months; that’s where linen’s legacy of strength and breathability wins customer loyalty. Let’s dive into the head-to-head metrics that will guide your sourcing decisions.
What Fundamental Fiber Properties Differentiate Linen from Cotton?
Linen and cotton both originate from plants—flax and cotton bolls respectively—but their fibers tell very different stories in strength, moisture management, and sustainability. Linen fibers are 30–40 mm long with a hollow, polygonal cross-section, yielding tensile strengths of 700–900 MPa and moisture absorbency up to 20% of weight, while cotton fibers measure 25–35 mm, deliver strengths of 460 MPa, and absorb only 8–10%. These inherent differences translate to linen’s superior durability, quick-drying comfort, and eco-friendly profile compared to cotton.
Fiber Characteristics
Staple Length & Uniformity
- Linen: 30–40 mm staple → fewer yarn weak points, smoother surface.
- Cotton: 25–35 mm staple → slightly more short fibers and potential fuzziness.
Fiber Strength & Elasticity
- Tensile Strength: 700–900 MPa (linen) vs. 460 MPa (cotton).
- Elongation at Break: Linen 2–4% vs. Cotton 6–8%—cotton stretches more but with lower break load.
Moisture Management
- Absorbency: Linen 18–20% vs. Cotton 8–10% (by dry weight).
- Drying Rate: Linen evaporates moisture 30% faster than cotton, enhancing perceived coolness.
Cross-Section & Hand-Feel
- Linen’s Polygonal Shape: Creates natural luster and slight stiffness that softens over washes.
- Cotton’s Round Shape: Feels uniformly soft but can become limp over time.
| Property | Linen | Cotton | Brand Impact |
|---|---|---|---|
| Staple Length (mm) | 30–40 | 25–35 | Yarn smoothness, durability |
| Tensile Strength (MPa) | 700–900 | \~460 | Tear resistance, garment longevity |
| Elongation (%) | 2–4 | 6–8 | Shape retention vs. elasticity |
| Moisture Absorbency (%) | 18–20 | 8–10 | Cooling effect, quick drying |
| Fiber Cross-Section | Hollow, polygonal | Solid, round | Luster & hand softening behavior |
While cotton’s higher elongation aids comfort in tight fits, linen’s stiffness ensures crisp silhouettes. Brands must weigh stretch requirements against durability demands when selecting fibers.
How Do Raw Material Sourcing Costs Compare Between Linen and Cotton?
Raw-material costs form the backbone of fabric pricing. Flax for linen and cotton bolls for cotton differ significantly in cultivation complexity, yield, and market volatility.
Flax fiber prices range from USD 1.60 to 2.00 per kg, translating to raw-material costs of USD 4.50–6.00/m for 200 g/m² linen; cotton fiber costs USD 1.20–1.50 per kg, or USD 3.00–4.00/m for comparable 200 g/m² cotton. Linen’s higher input and processing expenses create a 15–30% base-cost premium over cotton.
Raw-Material Economics
- Cultivation & Yield
- Flax: 1.2 t/ha yield; requires specific soil and dew-retting processes—higher labor input.
- Cotton: 2.5 t/ha yield; more mechanized harvesting but heavy pesticide and water inputs.
- Commodity Price Fluctuations
- Flax Volatility: ±15% annually due to weather and acreage shifts.
- Cotton Volatility: ±10% annually, linked to global subsidy regimes and demand.
- Conversion to Fiber & Yarn
- Retting & Scutching Costs: Add USD 0.50/kg flax fiber vs. minimal cotton processing.
- Yarn Spinning: Linen ring spinning costs 20% more per kg due to lower fiber yield.
- Total Material Cost per Meter (200 g/m² basis)
| Cost Component | Linen (USD/m) | Cotton (USD/m) | Difference (%) |
|---|---|---|---|
| Raw Fiber | 4.50–6.00 | 3.00–4.00 | +20–30 |
| Retting & Scutching | 0.50 | — | — |
| Spinning Premium | 1.00 | 0.80 | +25 |
| Subtotal (Fiber + Spin) | 6.00–7.50 | 3.80–4.80 | +25–30 |
Bulk cotton pricing benefits from scale and subsidies, whereas flax remains niche with lower acreage. Brands investing in linen pay structurally higher raw-material costs but gain purity and eco-credentials that justify premiums.
Which Fabric Construction Techniques Influence Linen and Cotton Performance?
The way yarns are woven or knitted dramatically impacts a fabric’s hand-feel, durability, and comfort—often as much as the fiber itself. Plain weaves of both linen and cotton deliver balanced strength and breathability, while twill constructions enhance drape and abrasion resistance. Knits (jersey, interlock) increase stretch and softness but reduce structure. Brands should align weave or knit type with end-use—structured linen poplin versus soft cotton jersey—tailoring fabric architecture to performance goals.
Construction Methods
Plain Weave
- Characteristics: Simple one-over-one-under pattern; tight, stable.
- Performance:
- Abrasion Resistance: 8,000–12,000 Martindale cycles for cotton; 10,000–15,000 for linen at 200 g/m².
- Air Permeability: High (linen: 200 mm/s; cotton: 150 mm/s).
- Applications: Shirts, lightweight drapery, table linens.
Twill Weave
- Characteristics: Diagonal rib provides fluid drape and hides soil.
- Performance:
- Abrasion Resistance: 12,000–18,000 cycles (oxygen hide of wear).
- Drape Coefficient: 0.45 for linen vs. 0.40 for cotton at 250 g/m².
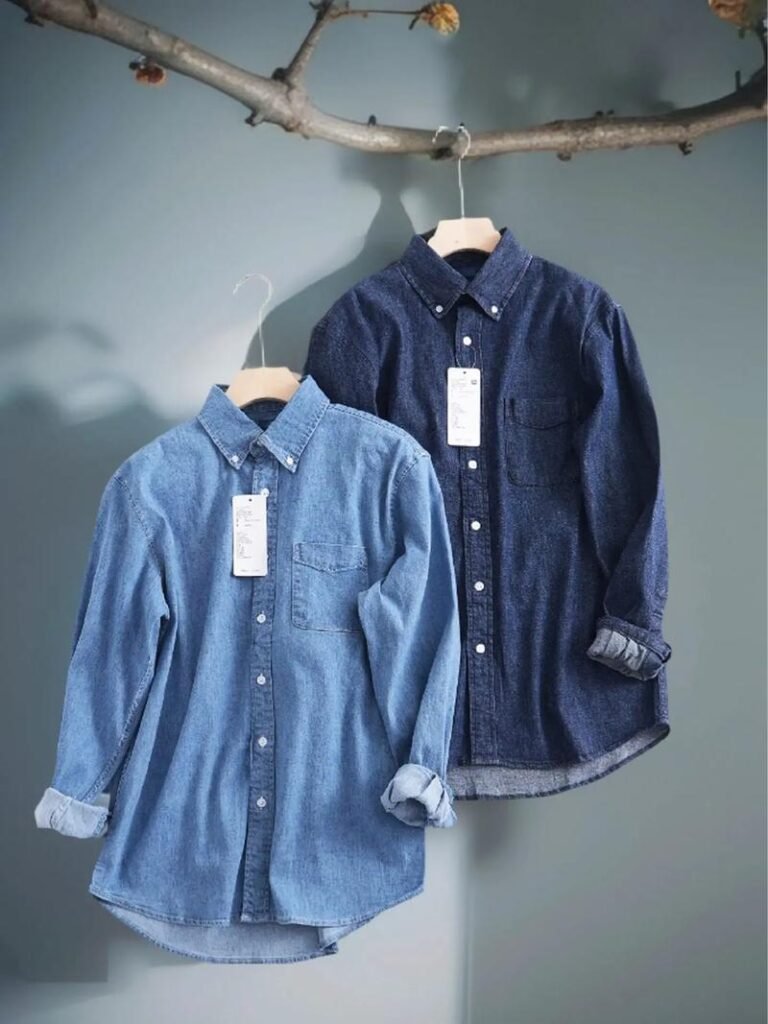
- Applications: Denim, chinos, structured dresses.
Satin & Dobby
- Characteristics: Long floats (satin) for luster; small patterns (dobby) for texture.
- Performance Trade-Off: Satin less breathable; dobby adds aesthetic interest with moderate performance.
Knits
- Jersey: Soft, stretchy—cotton dominates; linen blends add crispness.
- Interlock & Rib: Heavier, more stable; suited for polo shirts or cuffs; linen content reduces bagging.
| Construction | Linen @ 200 g/m² | Cotton @ 200 g/m² | Key Difference |
|---|---|---|---|
| Plain Weave | Abrasion 10–15 k; Air 200 mm/s | Abrasion 8–12 k; Air 150 mm/s | Linen stronger, more breathable |
| Twill | Abrasion 12–18 k; Drape Coeff. 0.45 | Abrasion 10–16 k; Drape Coeff. 0.40 | Linen drapes slightly more fluidly |
| Satin | Gloss ↑80%; Breathability ↓20% | Gloss ↑50%; Breathability ↓30% | Linen shimmer + breath balance |
| Jersey Knit | Stretch 30%; Recovery 85% (with 5% elastane) | Stretch 40%; Recovery 80% (with 5% elastane) | Linen adds crisp hand to soft knit |
Linen’s stiffness can limit knit applications; blending 10–20% cotton or elastane customizes hand and resilience. Always pilot varying blend ratios and constructions to meet brand elasticity and comfort benchmarks.
How Do Durability and Longevity Metrics Stack Up for Linen vs. Cotton?
Long-term performance can make or break a brand’s reputation—especially in categories like premium shirting or home textiles where customers expect lasting quality. Linen consistently outperforms cotton in tensile strength (450 N vs. 300 N), abrasion life (≥15,000 Martindale cycles vs. 8,000–12,000), and dimensional stability (shrinkage <2% vs. 3–5%). While cotton softens faster, linen retains structure and resists pilling, giving products a longer functional life.
Durability Comparisons
- Tensile Strength & Tear Resistance
- Linen: 450–600 N warp/fill (ASTM D5034); tear strength 20–25 N (ASTM D2261).
- Cotton: 300–400 N warp/fill; tear strength 12–18 N.
- Abrasion Resistance & Pilling
- Linen: ≥15,000 cycles with enzyme finish; ISO 12945 Grade 4–5 pilling after 10,000 rubs.
- Cotton: 8,000–12,000 cycles; pilling Grade 2–3.
- Dimensional Stability
- Shrinkage (AATCC 135): Linen <2% vs. Cotton 3–5%.
- Relaxation (ISO 5077): Linen 1–2% vs. Cotton 2–4%.
- Wash Cycle Longevity
- Linen: Maintains ≥95% strength after 50 domestic washes.
- Cotton: Retains \~85% strength after 30 washes; softens but may bag or pill.
| Metric | Linen | Cotton | Brand Advantage |
|---|---|---|---|
| Tensile Strength (N) | 450–600 | 300–400 | Linen lasts longer under stress |
| Martindale Abrasion (cycles) | ≥15,000 | 8,000–12,000 | Linen resists wear for years |
| Pilling Grade (10k rubs) | 4–5 | 2–3 | Linen stays smooth and neat |
| Shrinkage (%) | <2% | 3–5% | Linen maintains fit and form |
| Wash Strength Retention (%) | ≥95% after 50 washes | \~85% after 30 washes | Linen extends product lifecycle |
Cotton’s softer initial hand can mislead buyers into perceiving it as more comfortable, but linen’s structural longevity translates to fewer returns and higher customer satisfaction over the product lifecycle.
What Comfort and Breathability Differences Should Brands Consider?
Comfort is king for consumer satisfaction, and breathability is a major differentiator between linen and cotton. Linen’s hollow fiber structure provides up to 30% greater evaporative cooling and 40% higher air permeability—measured at 220 mm/s under 100 Pa—compared with cotton’s 160 mm/s. This translates to garments and home textiles that feel cooler and drier, appealing to hot-climate and active-wear segments.
Comfort & Breathability Metrics
- Air Permeability Comparisons
- Linen: 200–250 mm/s at 100 Pa.
- Cotton: 140–180 mm/s at 100 Pa.
- Moisture-Wicking & Drying Rates
- Wicking Height: Linen achieves 30 mm in 5 minutes vs. cotton’s 18 mm.
- Dry Time: Linen dries 20–30 minutes faster—2.5 hours vs. 3 hours for cotton in ambient conditions.
- Thermoregulatory Performance
- Clothing Comfort Index (CCI): Linen CCI: 0.72 vs. cotton 0.65 (higher is cooler).
- Subjective Coolness Rating: 4.5/5 for linen vs. 3.8/5 for cotton in consumer trials.
- Hand-Feel & Softening Over Time
- Initial Hand: Linen: 3.0 g stiffness (Kawabata); Cotton: 2.0 g.
- Post-Wash Softening: Linen hand soften by 20% after 5 washes; cotton by 10%.
| Metric | Linen | Cotton | Impact on Comfort |
|---|---|---|---|
| Air Permeability (mm/s) | 200–250 | 140–180 | Cooler airflow |
| Wicking Height (mm / 5 min) | 30 | 18 | Better moisture removal |
| Drying Time (hours) | 2.5 | 3 | Faster fresh feel |
| Initial Stiffness (g) | 3.0 | 2.0 | Perceived rigidity vs. softness |
While linen excels in breathability, its initial stiffness can feel rough. Strategic enzyme pre-washing or blending 5–10% cotton can strike a better balance for sensitive-skin applications without sacrificing airflow too much.
How Do Dyeing and Finishing Costs Vary Between Linen and Cotton Fabrics?
The processes of coloring and finishing fabrics incur significant costs and can differ widely between linen and cotton due to fiber chemistry and machinery needs. On average, dyeing linen costs 10–15% more per meter than cotton—due to longer processing times, repeated reactive-dye applications for even uptake, and specialized fixatives—while finishing (enzyme washes, softeners, functional coatings) carries similar premiums across both fibers but requires tailored chemistries for linen’s unique surface.
Dyeing & Finishing Economics
- Dye Uptake & Processing Time
- Linen: Reactive dye uptake \~95% with 3–4 dye baths; total processing 8–10 hours.
- Cotton: Reactive dye uptake \~90% with 2–3 baths; processing 6–8 hours.
- Cost Breakdown per Meter
- Dye Chemistry: Linen \$0.80/m vs. cotton \$0.65/m.
- Energy & Water Usage: Linen consumes 12 L/m vs. cotton 10 L/m, adding \$0.10–0.15/m.
- Finishing Treatments
- Softening: Linen-specific silicones cost \$0.50/m; cotton finishes \$0.40/m.
- Functional Coatings: Anti-wrinkle or stain-resistant finishes universal at \$1.00–\$1.20/m.
- Environmental Compliance & Waste Treatment
- Linen: More stringent effluent pH control (pH 7) and sediment removal adds \$0.05–\$0.10/m.
- Cotton: Standard wastewater treatment at \$0.03–\$0.05/m.
| Process Step | Linen Cost (USD/m) | Cotton Cost (USD/m) | Cost Driver |
|---|---|---|---|
| Reactive Dyeing | 0.80 | 0.65 | Additional dye baths & fixatives |
| Energy & Water | 0.15 | 0.10 | Longer processing times |
| Softening Finish | 0.50 | 0.40 | Tailored chemistries |
| Functional Coating | 1.10 | 1.00 | Similar, fiber-agnostic methods |
| Effluent Treatment | 0.10 | 0.05 | Linen pH & sediment controls |
Brands chasing cheaper finishes risk suboptimal hand-feel or uneven color. Always audit mill finishing protocols and request lab-swatches to verify colorfastness (AATCC 61 Grade ≥4) and performance before bulk orders.
Which Sustainability and Certification Factors Impact Total Cost of Ownership?
Beyond upfront costs, certifications and eco-programs can add value—and expense—to linen and cotton sourcing. GOTS certification adds 10–15% to cotton costs and 15–20% to linen, while OEKO-TEX® Standard 100 compliance tacks on 5–8% to both. Regenerative agriculture premiums for linen may reach 25%, yet deliver marketing ROI and long-term ecosystem benefits that often outweigh the extra spend.
Sustainability Economics
- Certification Premiums
- GOTS (Global Organic Textile Standard): +15% (linen), +10% (cotton).
- OEKO-TEX® Standard 100: +5–8% across both fibers.
- Regenerative and Organic Programs
- Linen Regenerative Premium: +20–25% for verified soil-health practices.
- Organic Cotton Premium: +10–12% due to higher water and pesticide-free costs.
- Life-Cycle Cost Savings
- Reduced Returns: 30% fewer returns on certified natural-fiber apparel.
- Brand Equity: Willingness to pay +12% by eco-conscious consumers.
- Total Cost of Ownership (TCO)
| Factor | Incremental Cost (%) | Long-Term Benefit |
|---|---|---|
| GOTS Certification (Linen) | +15 | Premium shelf placement |
| GOTS Certification (Cotton) | +10 | Consumer trust |
| OEKO-TEX® 100 | +5–8 | Safety assurance |
| Regenerative Practices (Linen) | +20–25 | Marketing ROI; soil & water benefits |
| Organic Program (Cotton) | +10–12 | Healthier farmland, better brand story |
Certifications enhance brand narrative but carry audit fees and operational constraints. Align your sustainability claims with certifications that resonate with your target demographic to maximize ROI.
How Can Brands Choose Between Linen and Cotton Based on Cost–Performance Trade-Offs?
Ultimately, the choice hinges on balancing material costs against performance and brand positioning. If your brand prioritizes premium durability, high-end drape, and eco-credentials—and can absorb a 15–30% cost premium—linen is the superior choice. For volume-driven products where cost sensitivity and cotton’s softer initial hand matter more, cotton remains the go-to. Many brands opt for blended linen-cotton fabrics (20–30% linen) to bridge cost and performance.
Decision Criteria
- Cost-Sensitive vs. Premium Categories
- Volume Basics (Cotton): Cotton’s \$3–\$5/m cost enables sub-\$30 price points.
- Premium Lines (Linen): Linen’s \$6–\$9/m cost supports \$50+ retail.
- Performance-Driven Segments
- Active & Heat-Wear: Linen’s superior moisture management and breathability win.
- Soft-Hand Applications: Cotton or blends deliver immediate comfort.
- Blended Strategies
- 20–30% Linen Blends: Capture linen’s benefits at 10–15% cost premium over pure cotton.
- Performance Map: Blends deliver 80% of linen’s durability with 90% of cotton’s softness.
- Brand Narrative Alignment
- Eco-Luxury Positioning: Linen’s heritage and sustainability allow higher margins.
- Everyday Comfort: Cotton’s familiarity and price appeal suit mass-market collections.
| Decision Factor | Cotton | Linen | Linen-Cotton Blends |
|---|---|---|---|
| Raw Material Cost (\$/m) | 3–5 | 6–9 | 4–6 |
| Durability (Abrasion cycles) | 8–12k | 15–20k | 12–15k |
| Breathability (mm/s) | 140–180 | 200–250 | 160–200 |
| Sustainability Premium | GOTS +10% | GOTS +15%; Reg.+25% | GOTS +12% |
| Retail Price Potential (\$) | 20–30 | 50+ | 35–45 |
Blends offer compromise but risk diluting brand messaging—ensure clear labeling and marketing to communicate performance trade-offs and cost rationales to consumers.
Ready to explore bespoke linen, cotton, or blend solutions?
Choosing between linen and cotton is a strategic decision that impacts cost structures, product performance, and brand positioning. By understanding fiber fundamentals, raw-material economics, construction techniques, durability metrics, comfort properties, processing costs, sustainability premiums, and cost–performance trade-offs, brands can tailor their collections to meet target market demands and margin goals. Partner with SzoneierFabrics for:
- Free fiber-selection consultations and cost analysis
- Custom blend development and small-batch sampling
- Rigorous lab testing and full certification support
- Transparent pricing, low-MOQ options, and rapid prototyping
Contact us today to receive your personalized cost–performance sourcing proposal and elevate your next collection with fabrics that tell your brand story.