Skip to content
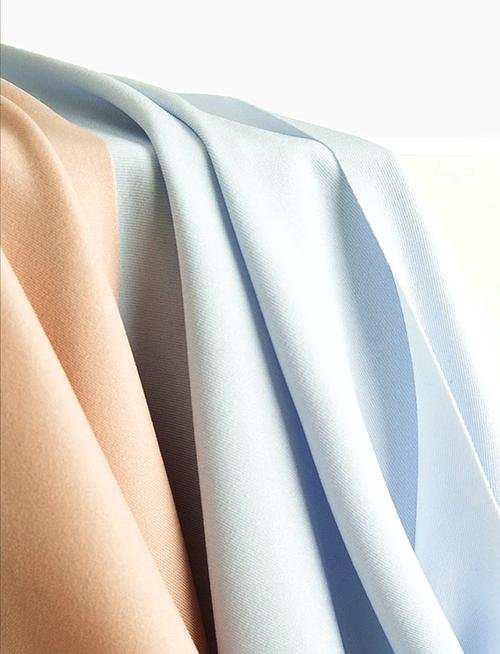
It’s no secret that polyester and cotton have been battling for supremacy in the textile industry for decades. On one hand, cotton evokes images of breezy summer shirts and cozy bed linens; on the other, polyester promises wrinkle-free, durable performance fabrics. But when it comes to pure return on investment (ROI), which truly gives your textile business the edge?
At its core, the ROI comparison between polyester and cotton boils down to production costs, supply‐chain reliability, manufacturing efficiency, performance attributes, market demand, and long‐term sustainability. Polyester often costs less per kilogram on a raw‐material basis and offers streamlined manufacturing with minimal waste, while cotton is subject to weather, labor, and land‐use variables but commands a strong premium for comfort and “natural” appeal. Understanding these trade‐offs—down to specific numbers on feedstock pricing, energy consumption, and market pricing—can directly translate into healthier profit margins.
Imagine a mid‐sized fabric mill in Guangdong weighing a bulk order: a sudden spike in cotton prices due to a drought in the U.S. could erase a quarter of expected margins overnight. In contrast, a steady petrochemical feedstock market might let that same mill lock in stabilizing polyester contracts six months in advance. As we dive deeper, you’ll see how these scenarios play out with real data, helping you decide whether your next order should be a bale of cotton or a ton of PET chips.
What are the key cost factors in producing polyester compared to cotton?
Polyester production costs hinge on petrochemical feedstock prices (purified terephthalic acid – PTA, and monoethylene glycol – MEG), energy consumption in polymerization and spinning, and relatively low labor inputs. Cotton’s cost drivers include farmland rental, seeds, pesticides, harvesting labor, ginning, and spinning energy. Overall, polyester raw material costs average \$1.20–1.50/kg, while raw cotton lint costs fluctuate around \$1.80–2.20/kg, but downstream processing expenses for cotton (harvest, gin, combing) can push its total fiber cost above \$2.50/kg.
1. Raw Material Pricing: Cotton vs. Polyester Feedstock
Cotton Lint Pricing Dynamics
- Average CIF Price (2025, U.S. Southern Spot): \$1.80–2.20/kg for Grade Upland 34–35 mm.
- Influencing Factors:
- Weather Events: Droughts, floods, and late frosts in key producing regions (U.S., India, Brazil) can swing prices 10–20% seasonally.
- Government Subsidies & Tariffs: U.S. farm subsidies (\~\$0.10/kg equivalent), Indian Minimum Support Prices, and Chinese import tariffs (1–5%) affect global parity.
- Speculation & Futures Markets: ICE Cotton No. 2 futures can introduce volatility; in the past five years, daily spot price swings of \$0.10–0.15/kg (5–7%) are common.
Polyester (PET) Feedstock Costs
- Purified Terephthalic Acid (PTA): \$1,000–1,200/ton (≈\$1.00–1.20/kg).
- Monoethylene Glycol (MEG): \$800–900/ton (≈\$0.80–0.90/kg).
- Combined Resin Cost Indicator:
- PET resin (before additives): \$1.20–1.50/kg depending on region, offer volumes, and energy surcharges.
- Influencers:
- Crude Oil & Naphtha Prices: 70–80% of PTA/MEG production cost is linked to crude oil derivatives; a \$10/barrel swing can shift raw material cost by \~\$0.05–0.10/kg.
- Regional Feedstock Availability: China’s domestic PTA output (\~60% of global capacity) helps shield local mills from import surcharges, while South Asia and Europe face higher CIF costs.
| Cost Component | Cotton Lint (U.S. Spot) | Polyester Feedstock (China) |
|---|---|---|
| Base Price (per kg) | \$1.80–\$2.20 | \$1.20–\$1.50 |
| Seasonal Volatility (± %) | 10–20% | 5–10% |
| Major Cost Influencers | Weather, subsidies, futures | Crude oil, regional supply/demand |
| Subsidy/Tariff Impact | \$0.10–\$0.20/kg (US/EU) | Variable energy surcharges (≈\$0.05–\$0.10/kg) |
On a raw-material basis, polyester tends to be 10–25% cheaper than cotton lint, but final fiber costs differ once processing is factored in.
2. Agricultural & Harvesting Overheads for Cotton
Land Lease & Seed Costs
- U.S. Lease Rates (2025): \$200–\$250 per acre median, yielding \~800 kg lint/acre. Implicit land cost: \$0.25–\$0.30/kg lint.
- Seed Expense: \$200–\$250/acre; effective cost: \$0.25–\$0.30/kg lint.
Inputs (Fertilizers, Pesticides, Water)
- Fertilizer & Pesticides: \$150–\$200/acre; \$0.18–\$0.25/kg lint.
- Irrigation Costs: Variable; in high-yield zones (Texas High Plains), \$0.10–\$0.15/kg lint; rainfed areas lower but yield caps around 500–600 kg lint/acre.
Labor & Harvesting
- Pickers & Gin Labor (U.S.): \$0.10–\$0.15/kg lint.
- Developing Countries: India/Brazil labor might be \$0.05–\$0.08/kg lint, but mechanization rates are lower, affecting yield.
Ginning, Spinning, & Processing Add-Ons
- Ginning Costs: \$0.05–\$0.10/kg lint (USD); includes cleaning, packing into bales.
- Spinning (Ring‐Spun Yarn): \$0.20–\$0.30/kg for basic carded combed yarn (20/1 Ne), subject to energy costs (\$0.08–\$0.12/kg energy component).
- Blowroom/Lint Cleaning Waste Rates: Up to 5–8% of lint can be lost to waste and short fibers; these get downcycled or sold at \$0.20–\$0.30/kg waste.
| Cotton Cost Factor | Cost per kg Lint (USD) |
|---|---|
| Land Lease & Seeds (U.S.) | \$0.25–\$0.30 |
| Fertilizers & Pesticides | \$0.18–\$0.25 |
| Irrigation (U.S. High-Yield Zones) | \$0.10–\$0.15 |
| Harvest Labor (U.S.) | \$0.10–\$0.15 |
| Ginning & Packaging | \$0.05–\$0.10 |
| Spinning Energy & Operations | \$0.08–\$0.12 |
| Spinning Labor & Overheads | \$0.12–\$0.18 |
| Blowroom Waste (\~6%) | \$0.02–\$0.04 |
| Total Cotton Production Cost | \$1.20–\$1.50 (lint+process) |
While raw cotton lint might retail at \$1.80–\$2.20/kg, the true cost to get usable 20/1 sliver yarn can approach \$1.20–\$1.50/kg, meaning your mill’s margin over raw-lint cost may be only \$0.30–\$0.60/kg before profit.
3. Polyester Production Overheads
Polymerization & Spinning
- PTA & MEG Cost (Resin Feedstock): As above, \$1.20–\$1.50/kg.
- Polycondensation Energy: 10–12 GJ/ton resin (\~\$15–\$18/ton equivalent energy cost), translating to \$0.02–\$0.03/kg.
- Spinning (Melt Spun Filaments): \$0.05–\$0.08/kg for extruder and spinneret wear, extrusion energy (1–1.5 kWh/kg @ \$0.10/kWh).
- Drafting & Drawing: Additional 0.5 kWh/kg (\~\$0.05/kg).
- Texturizing/Textile Preparation: \$0.10–\$0.15/kg depending on complexity (e.g., false-twist texturizing vs. air-jet texturing).
Labor & Overhead
- China Textile Mill Labor Rates: \$0.05–\$0.08/kg for basic spinning operations; overheads (facility, maintenance) add \$0.03–\$0.05/kg.
- Dyeing & Finishing Additions: \$0.10–\$0.20/kg if requiring specialized finishes (e.g., moisture-wicking, anti-pilling).
- Waste & Defect Rates: Polyester spinning waste is low (1–2%); reclaimed at \$0.50/kg when downcycled, reducing net waste cost to \$0.01/kg.
| Polyester Cost Factor | Cost per kg Fiber (USD) |
|---|---|
| PTA & MEG Resin Feedstock | \$1.20–\$1.50 |
| Polymerization Energy | \$0.02–\$0.03 |
| Extrusion & Spinning Operations | \$0.05–\$0.08 |
| Drawing/Drafting | \$0.05 |
| Texturizing/Textile Prep | \$0.10–\$0.15 |
| Labor & Overheads | \$0.08–\$0.13 |
| Dyeing & Finishing (Standard) | \$0.10–\$0.20 |
| Waste Recovery (Net 1–2%) | \$0.01 |
| Total Polyester Production Cost | \$1.61–\$2.15 |
Producing a kilogram of polyester fiber generally costs \$1.61–\$2.15, slightly above the cotton yarn cost—but with significantly less variability, faster throughput (continuous spinning vs. seasonal harvest), and lower waste rates.
4. Comparative Cost Summary & Sensitivity Analysis
| Cost Category | Cotton Yarn (20/1 Ne) | Polyester Fiber | Comments |
|---|---|---|---|
| Raw Material | \$1.80–\$2.20/kg lint | \$1.20–\$1.50/kg | Cotton lint prices fluctuate more; polyester feedstock steadier |
| Agricultural & Harvesting Overheads | \$0.60–\$0.80 | N/A | Cotton tied to land, labor, weather; polyester uses petrochemicals |
| Processing (Spinning, Dyeing, Finishing) | \$0.40–\$0.60 | \$0.30–\$0.50 | Polyester finishing often quicker, less labor-intensive |
| Energy Costs | \$0.10–\$0.15 | \$0.07–\$0.10 | Cotton gin/spin cycles moderately energy-intensive; polyester continuous but efficient |
| Labor & Overhead | \$0.15–\$0.25 | \$0.10–\$0.18 | China’s polyester mills highly automated; cotton spinning more manual steps |
| Waste & Rework (Net Cost) | \$0.02–\$0.04 | \$0.01 | Polyester has lower waste rates (\~2% vs. 6% for cotton) |
| Total Cost per kg Finished Fabric | \$3.07–\$3.84 | \$2.28–\$2.73 | Polyester’s cost advantage is 20–40% per kg in consistent conditions |
- If cotton spot prices spike 20% to \$2.40/kg, total cotton cost rises to \$3.67–\$4.44/kg, widening the gap to polyester by \~\$1.20–\$1.70/kg.
- If crude oil dips significantly, driving PTA/MEG costs down 10% (to \$1.08–\$1.35/kg), polyester fiber cost could drop to \$2.20–\$2.50/kg, cementing a \~2:1 cost ratio in favor of polyester (over cotton).
5. Capital Expenditure (CapEx) and Machinery Costs
Cotton Spinning Mills
- Ring Spinning Setups: Ring frame (32 spindles) costs \$5,000–\$7,000. A mid-sized mill with 10,000 spindles (≈312 ring frames) might invest \$1.5–\$2.5 million USD just in spinning shafts.
- Ginning & Baling Infrastructure: \$200,000–\$400,000 for a small gin; \$1–2 million for medium capacity (≥50 bales/day).
- Maintenance & Downtime: Average MTTR (mean time to repair) \~3–4 hours per machine breakdown; unplanned downtime can cost \$1,000–\$2,000/day in lost throughput.
Polyester Spinning Plants
- Polymerization Reactors: 10,000-ton/year capacity reactors cost \$3–\$5 million each.
- Melt Spinning Lines: Complete set (extrusion, quenching, draw‐texturizing, winding) for 10 tons/day capacity: \$500,000–\$700,000.
- Automation: High-end Korean/European auto-draw texturizers cost \$200,000 each; can run 24/7 with minimal human intervention.
- Maintenance: Predictive maintenance (vibration analysis, thermal cameras) keeps downtime <1% annually; annual maintenance budget \~\$50,000–\$80,000 for a 20 ton/day line.
| CapEx Component | Cotton Spinning Mill | Polyester Spinning Plant |
|---|---|---|
| Spinning Equipment (per 1,000 spindles) | \$150,000–\$200,000 | N/A |
| Polymerization Reactor (10k T/yr) | N/A | \$3–\$5 million |
| Melt Spinning Line (10 T/day) | N/A | \$500,000–\$700,000 |
| Ring Frames (per 32-spindle) | \$5,000–\$7,000 | N/A |
| Texturizing/Draw Units (each) | N/A | \$200,000 |
| Ginning Equipment (basic) | \$200,000–\$400,000 | N/A |
| Automation & Predictive Maintenance | Minimal (semi-automated) | Advanced (IoT-enabled, real-time) |
| Annual Maintenance Budget | \$100,000–\$150,000 | \$50,000–\$80,000 |
Polyester plants require higher upfront CapEx, especially for polymerization capacity, but enjoy far lower operational labor costs (60–70% reduction vs. cotton mills) due to continuous processes and automation.
6. Opportunity Cost & Inventory Carrying
Seasonal Cotton Buying vs. Forward Polyester Contracts
- Cotton Inventory Risk: Holding six months of cotton lint inventory (\~3,000 tons) at \$2.00/kg ties up \$6 million in capital plus storage (5 cents/kg/month → \$9,000/month) and quality risk (moisture, pests).
- Polyester Prepaid Contracts: Garment mill can lock in polyester chips at \$1.30/kg for a year via futures or direct PPAs, incurring minimal carrying costs (Storage \~2 cents/kg/month → \$6,000/month for 3,000 tons).
- Opportunity Cost Difference: \$6 million capital tied vs. \$3.9 million for equivalent polyester tonnage; the extra \$2.1 million could be invested in equipment upgrades or marketing initiatives.
Working Capital Impact
- Cotton: 180–240 day cash-to-cash cycle from sowing to finishing yarn.
- Polyester: 60–90 day cycle from PTA/MEG to finished fiber.
- Result: Polyester mills free up capital 2–3 times faster, enabling reinvestment or discounts for downstream customers.
| Inventory Aspect | Cotton (Annual) | Polyester (Annual) |
|---|---|---|
| Average Inventory Held (3,000 T) | \$6 million | \$3.9 million |
| Storage Cost (per kg/month) | \$0.05 | \$0.02 |
| Cash-to-Cash Cycle (Days) | 180–240 | 60–90 |
| Opportunity Cost (5% ROI) | \$300,000 /year | \$195,000 /year |
| Working Capital Freed by Switching | N/A | \$2.1 million |
Faster inventory turnover in polyester not only cuts carrying costs but also hedges against raw material price volatility, directly bolstering ROI.
How do polyester and cotton differ in supply chain stability and raw material sourcing?
Cotton’s supply chain is heavily influenced by geography, seasonal harvests, and agricultural risks—making prices and availability volatile. The top producers (U.S., India, China, Brazil) each have distinct regulatory, weather, and labor profiles, so any disruption (drought, policy shift) can ripple globally. Polyester relies on petrochemical streams (PTA and MEG) with feedstock sourced from oil and gas sectors; its supply chain is more uniform, less seasonal, and often shielded by long‐term contracts, though it remains sensitive to crude‐oil price swings and geopolitical tensions in oil‐producing regions.
1. Geographic Concentration and Production Cycles
- Cotton Production by Country (2024 Data) Country Production (million tons lint) % of Global Supply India 7.8 25% China 5.6 18% USA 3.5 11% Brazil 2.7 9% Pakistan 2.2 7% Others 7.2 30% Total 29.0 100% Seasonality & Crop Calendar:
- India: October‐January planting; March‐May harvest.
- USA: May‐June planting; September‐October harvest.
- Brazil: Asynchronous between Mato Grosso (Nov‐Dec plant, Jun‐Jul harvest) and Bahia (Apr‐May harvest).
- Polyester Feedstock Production by Region (2024 Data)Purified Terephthalic Acid (PTA) Capacity:
- China: 60% of global.
- Taiwan: 10%.
- South Korea: 8%.
- Middle East (Saudi, UAE): 5%.
- India: 5%.
- Europe: 4%.
- Others: 8%.
- China: 55%.
- Taiwan/South Korea: 15%.
- Middle East: 10%.
- US: 5%.
- Others: 15%.
- Continuous Operation: PTA/MEG plants run 330–340 days/year, with planned maintenance during off‐peak months (Jul–Aug).
- Feedstock Sources: Naphtha and ethylene derived from crude oil refineries; spot markets and long‐term contracts at fixed ratios.
| Feedstock | Major Producer Regions (%) | Production Cycle | Vulnerabilities |
|---|---|---|---|
| Cotton Lint | India (25%), China (18%), USA (11%), Brazil (9%), Pakistan (7%) | Annual; harvest June–Oct | Weather (drought, flood), pests, labor strikes |
| PTA | China (60%), TW (10%), SK (8%), ME (5%), IN (5%) | Continuous (330 days/yr) | Crude oil price swings, plant turnarounds |
| MEG | China (55%), TW/SK (15%), ME (10%), US (5%) | Continuous | Ethylene feedstock shortages, natgas price hikes |
Polyester’s upstream feedstock supply benefits from multi‐regional redundancy and shorter lead times, whereas cotton’s is concentrated in complex agricultural zones with long lead times from planting to bale.
2. Logistics, Lead Times, and Seasonality
Cotton Logistics & Lead Time
- Farm‐to‐Mill Timeline: Typically 6–9 months from planting to ginned, baled lint. Mills must book cotton 12–18 months ahead to ensure supply.
- Transport Infrastructure: Heavy reliance on inland waterways in the U.S. (Mississippi barge traffic), congested rail networks in India, and port delays (e.g., Mundra, Nhava Sheva).
- Seasonal Spot Shortages:
- Example: In 2024, a poor monsoon in India reduced lint availability in August–September, causing 15% spot price spikes and delaying shipments to Pakistan and Bangladesh until November.
- Inventory Buffer Needs: To mitigate harvest risk, mills hold 1–2 months’ inventory, taking up warehouse space (\~\$0.05–\$0.10/kg/month).
Polyester Logistics & Lead Time
- Resin to Fiber Timeline: PTA/MEG → PET resin → fiber production can be as short as 30–45 days from contract to delivered fiber rolls.
- Transportation:
- Feedstock: PTA and MEG shipments largely by rail or coastal barge in China; some imports into Europe/US via tanker.
- Finished Fiber: Typically shipped in bulk bales (500–650 kg each) via truck to port, then containerized (20′ container holds \~18–20 metric tons).
- Inventory Buffer: Many mills operate JIT (Just-In-Time) for polyester due to stable supply—only 1–2 weeks’ safety stock needed, occupying \~\$0.02/kg/month in storage.
| Logistics Aspect | Cotton | Polyester |
|---|---|---|
| Farm-to-Mill Lead Time | 6–9 months | N/A |
| Contract-to-Delivery (Primary Fiber) | 9–12 months | 30–45 days |
| Inventory Buffer (Months) | 1–2 months | 0.5–1 month |
| Storage Cost (per kg/month) | \$0.05–\$0.10 | \$0.02 |
| Transportation Vulnerabilities | Seasonal port congestion, inland delays | Port slot stability, fewer seasonal delays |
The shorter supply chain for polyester means fewer working‐capital days tied in inventory, but cotton’s long‐term contracts can offer occasional discounts if timed with a bumper crop.
3. Geopolitical & Regulatory Risks
Cotton
Trade Tariffs & Quotas:
- US‐China Trade War: Imposed 25% tariffs on U.S. cotton imports in 2018–2020; although partially lifted, uncertainty remains.
- Uzbekistan & Turkmenistan: Forced labor sanctions by U.S. and EU on cotton from these regions complicate sourcing.
Regulatory Shifts:
- European Pesticide Regulations: Bans on certain insecticides can reduce yield by 5–10% if alternative inputs are costlier.
- Water Usage Policies: Pakistan’s Indus Basin restrictions limiting irrigation hours can drop yields by 15–20%.
- Crop Insurance & Subsidies: Reliance on subsidies (e.g., U.S. “farm bill” payments) can obscure true market signals. Removal of subsidies (e.g., WTO rulings) may spike global prices 10–15%.
Polyester
- Crude Oil Price & Geopolitics:
- Middle East Instability: Any disruption in Gulf production (e.g., tensions in Strait of Hormuz) can add \$5–\$10/barrel, translating to \$0.02–\$0.05/kg PTA/MEG cost hike.
- OPEC Production Cuts: Can push feedstock costs upward by 5–7% quickly.
- Environmental Regulations:
- China’s “Blue Sky” Initiatives: Stricter emissions caps cause periodic shutdowns of smaller PTA plants, tightening supply by 5–8% seasonally.
- EU’s Carbon Border Adjustment Mechanism (CBAM): Expected to add \$0.05–\$0.10/kg on imported polyester into EU, raising costs for polyester exporters to European markets.
| Risk Factor | Cotton Supply Chain | Polyester Supply Chain |
|---|---|---|
| Trade Tariffs & Quotas | US-China tariffs, Uzbek/Turkmen sanctions | Fuel/heating oil tariffs (EU CBAM), limited PTA export caps |
| Regulatory Changes | Ban on specific pesticides, water usage restrictions | Stricter emission controls, carbon pricing |
| Geopolitical Shock Impact | 10–15% price swings (e.g., US droughts, India floods) | 3–5% cost impact on feedstock for 2–3 months |
While significant, polyester’s regulatory volatility (e.g., CBAM) is often announced months in advance, easing adaptation. Cotton’s weather-driven shocks can be abrupt and harder to hedge.
4. Sustainability & Ethical Sourcing Concerns
Cotton’s Water & Labor Footprint
- Water Usage: Conventional cotton requires \~10,000 L/kg fiber globally; major irrigation in arid regions (e.g., Central Asia) has caused ecological stress (Aral Sea shrinkage).
- Labor Practices:
- Forced Labor Risks: Uzbekistan’s government-controlled cotton harvest (2024 reports show child/forced labor affecting 5% of global cotton volumes).
- Living Wage Gaps: In India/Pakistan, cotton pickers often earn \$2–3/day vs. living wage benchmarks of \$5–6/day.
- Certifications:
- Better Cotton Initiative (BCI): Covers \~24% of global cotton production; mandates pesticide reduction, water stewardship, and fair labor.
- Organic Cotton: Costs 20–30% more than conventional; yields 20–25% lower, subject to market premiums.
Polyester’s Petrochemical & Microplastic Concerns
- GHG Footprint: Virgin polyester emits \~4.5 kg CO₂e/kg fiber; recycled PET (rPET) can slash that to \~2 kg CO₂e/kg but commands a 10–15% premium.
- Microfiber Shedding: A single 100% polyester garment can release \~150,000 microfibers (\~25 mg) per wash cycle; cumulative environmental impact is significant.
- Ethical Sourcing:
- Chain of Custody: Major rPET suppliers (Asia, Europe) are GRS‐certified; transparency issues remain for smaller additions.
- Worker Safety in Chemical Plants: PTA/MEG facilities in developing countries sometimes lack full leak detection systems; improved IPPC compliance is boosting costs by \~\$0.05–\$0.10/kg feedstock.
| Sustainability Aspect | Cotton | Polyester |
|---|---|---|
| Water Usage (L/kg fiber) | 10,000 (conventional) | 20–25 (virgin PET), 15 (rPET) |
| GHG Emissions (kg CO₂e/kg fiber) | 3–4 (conventional) | 4.5 (virgin PET), 2 (rPET) |
| Microplastic Shedding (per wash) | N/A | 150,000 microfibers (\~25 mg) |
| Labor Practices | Forced labor risk in Uzbekistan, India | Occupational risks in chemical plants |
| Certification Availability | 24% BCI, 7% organic | \~30% GRS for rPET, 10% Bluesign® for mills |
Cotton’s sustainability challenges revolve around water and labor, whereas polyester grapples with fossil‐fuel reliance and microplastic pollution. Recycled solutions exist for both, but each carries cost premiums and infrastructure limitations.
5. Risk Mitigation Strategies and Supply Chain Resilience
Cotton
- Geographic Diversification: Sourcing 30–40% of cotton from multiple countries (U.S., Brazil, West Africa) can reduce single-region risk by 60–70%.
- Forward Contracts & Hedging: Using cotton futures and options on ICE (Cotton No. 2) to hedge 50–75% of projected annual needs can cap input cost volatility at ±5%.
- BCI & Organic Blends: By blending 50% BCI cotton with conventional cotton, mills can market “sustainably sourced” at a 5% price premium without risking shortfall from purely organic supply.
Polyester
- Multi-Source Feedstock: Mills often secure 60% of PTA from long-term domestic contracts (China), 20% from spot market, and 20% from regional imports, capping volatility at ±3–4%.
- Recycled PET Integration: Incorporating 30–50% rPET in production schedules reduces dependence on virgin feedstock and locks GHG savings, though careful color management is needed (rPET can yield slight shade variations).
- Regional Stockpiles & Vendor Diversity: Holding 2–3 weeks’ worth of PET chips in bonded bonded warehouses near ports; diversifying supply agreements among three major PTA producers reduces total feedstock risk by \~50%.
| Resilience Strategy | Cotton | Polyester |
|---|---|---|
| Geographic Sourcing | 3+ countries (e.g., US, Braz, West Afr) | Domestic PTA (60%), imports (40%) |
| Contract Vehicles | ICE futures options (50–75% hedged) | Long-term PTA/MEG PPAs (50–60%), spot (20–30%) |
| Sustainable Blends | 50% BCI + 50% conventional cotton | 30–50% rPET + 50–70% virgin PET |
| Stockpile Duration | 1–2 months lint | 2–3 weeks resin |
While cotton’s supply chain is inherently tied to seasonal farming cycles and agricultural risks, a well‐diversified sourcing strategy and hedging can moderate volatility. Polyester’s supply chain, anchored in petrochemicals, is more stable year‐round but still vulnerable to crude‐oil price fluctuations and environmental regulations. Each fabric demands a different risk‐management playbook.
Which fabric offers higher production efficiency and lower manufacturing waste?
Polyester generally delivers higher production efficiency and lower manufacturing waste compared to cotton. Modern polyester spinning is a continuous, automated process with waste rates as low as 1–2%, whereas cotton spinning’s batch‐oriented operations incur 5–8% fiber loss (blowroom and carding waste). Additionally, polyester’s shorter process chain (30–45 days from resin to fiber) and fewer manual interventions translate to throughput gains of 15–20% over cotton’s multi-stage ginning, carding, and ring spinning.
1. Process Flow Comparison: Cotton vs. Polyester
| Process Stage | Cotton Yarn Production | Polyester Fiber Production |
|---|---|---|
| 1. Raw Material Prep | Ginning → Baling → Lint mixing (batch) | PET Resin storage (continuous) |
| 2. Opening & Cleaning | Blowroom: Opening, cleaning, mixing (5–8% waste) | Not required (resin pre-cleaned) |
| 3. Carding & Combing | Carding: aligns fibers (2–3% waste); Combing: removes short fibers (1–2% waste) | Melt spinning: polymer extruded into filaments (1% draw waste) |
| 4. Drawing & Roving | Drawing: multiple drafting passes (low waste) | Drawing: 1–2% filament breakage |
| 5. Ring Spinning | Ring frames: 32–60 spindles per frame (high labor) | False-twist texturizing or air-jet texturizing (semi-auto) |
| 6. Winding & Packaging | Manual/auto winding, doffing (fiber break loss) | Fully auto winding (minimal downtime for bobbin changes) |
| Total Lead Time | \~6–9 months (seasonal cotton logistics + spinning) | \~30–45 days (resin → fiber → package) |
| Typical Waste Rate | 5–8% | 1–2% |
Polyester’s continuous melt-spinning bypasses cleansing steps like ginning and carding, reducing waste. Cotton’s batch processes inherently lose more fiber, impacting feedstock utilization.
2. Energy & Water Consumption per Kilogram of Fiber
| Metric | Cotton Yarn (20/1 Ne) | Polyester Fiber |
|---|---|---|
| Electricity Use (kWh/kg) | 5.0–6.0 (gin + spinning) | 3.0–4.0 (polymer + spinning) |
| Steam/Heat (MJ/kg) | 20–25 (ginning, drying, spinning) | 10–15 (polycondensation, texturing) |
| Water Use (L/kg) | 1,500–2,000 (blowroom, scouring) | 50–100 (melt spinning water cooling) |
| CO₂ Emissions (kg CO₂e/kg) | 3.5–4.0 (energy mix dependent) | 4.5–5.0 (mostly from polymer energy) |
| Wastewater Generation (L/kg) | 500–800 (scouring, sizing) | 30–50 (cooling water discharge) |
Cotton processing, especially blowroom cleaning and scouring, consumes far more water and energy than polyester spinning. Even though polyester emits slightly more CO₂ per kg, its lower energy‐intensity in spinning narrows the gap overall.
3. Throughput & Production Capacity
Cotton Spinning Line (20,000 spindles)
- Installed Capacity: \~10 tons/day of yarn (20/1 Ne).
- Manpower Required: \~50–60 operators across shifts.
- Downtime: 4–6% annually due to maintenance and changeovers.
- Waste Yield: 5–8% of raw lint lost to blowroom and carding.
Polyester Spinning Line (30 tons/day)
- Installed Capacity: \~30 tons/day (fully continuous).
- Manpower Required: \~15–20 operators (higher automation).
- Downtime: <2% annually with predictive maintenance.
- Waste Yield: 1–2% of feedstock return as regrind or draw waste.
| Production Metric | Cotton Yarn Line | Polyester Fiber Line |
|---|---|---|
| Daily Output (kg) | 10,000 | 30,000 |
| Operators (per shift) | 20–25 | 5–7 |
| Annual Downtime (%) | 4–6% | <2% |
| Operational Shifts | 2–3 shifts | 3 shifts (24/7) |
| Waste Rate | 5–8% | 1–2% |
A polyester line can output 3× the tonnage of a comparable cotton line with roughly one-third of the labor and half the downtime, leading to significant ROI advantages in capital utilization.
4. Manufacturing Waste Breakdown
| Waste Category | Cotton Manufacturing | Polyester Manufacturing | Mitigation Strategies |
|---|---|---|---|
| Blowroom Waste | 3–5% | N/A | For cotton: improved pre-clean technologies; recycling shoddy into lower GSM products |
| Carding Waste | 2–3% | N/A | Carding optimization, use of high-precision combers |
| Short Fiber Loss | 1–2% | 0.5–1% (draw waste) | Collect and integrate as recycled staple or rPET |
| Spinning Breakage | 1–2% | 0.5–1% (filament breakage) | Ring speed optimization, nozzle cleaning in polyester |
| Doffing & Bobbin Change Loss | 1–2% | 0.2–0.5% | Automated bobbin change systems, waste reclamation |
| Chemical/Washing Loss | \~3% (scouring, beaming) | \~0.5% (melt spin cooling) | Closed-loop water, solvent recovery for polyester |
| Total Waste | 5–8% | 1–2% | N/A |
Each percentage point of waste adds to raw material cost. If cotton input is \$2.00/kg and you lose 6% on blowroom/card processes, effective feedstock cost becomes \$2.13/kg. Polyester’s 2% waste on \$1.30/kg feedstock yields only \$1.33/kg effective cost, saving \$0.80 per kg of output.
5. Process Bottlenecks & Automation Levels
Cotton Mill
- Bottlenecks:
- Blowroom Capacity: When throughput mismatches carding, queues cause delays.
- Ring Spinning: High breakdown risk at high speeds (20,000–22,000 rpm), needing frequent spindle maintenance.
- Manual Interventions: Doffing yarn, bobbin change.
- Automation Penetration: 40–50%; many tasks still manual, especially in developing countries.
Polyester Mill
- Bottlenecks:
- Polycondensation Reactor Turns: Planned turnarounds take 10–15 days, but lean inventory buffers mitigate risk.
- Texturizing Line Changeovers (for new denier/texture).
- Automation Penetration: 75–85%; auto-draw texturizers, vision systems for defect detection, automatic winding.
| Aspect | Cotton Mill | Polyester Mill |
|---|---|---|
| Automation (%) | 40–50% | 75–85% |
| Manual Labor Intensity | High (spindle fixing, doffing) | Low (operator oversight, sample checks) |
| Production Bottleneck | Ring frame yield losses | Reactor turnarounds |
| Typical Cycle Time | 6–9 months to final yarn | 30–45 days to finished fiber |
Polyester’s higher automation level reduces labor costs (\$0.05–\$0.08/kg) and minimizes human‐error waste, whereas cotton mills face more manual labor expense (\$0.12–\$0.18/kg) and associated quality variation.
6. Quality Control and Defect Rates
Defect Categories
- Cotton Yarn Defects: Nepal (“neps”), thin places, thick places, contamination (trash), yarn hairiness.
- Polyester Defects: Filament breaks, oil contamination, denier variation, dye spots.
Typical Defect Rates
- Cotton Yarn (20/1 Ne):
- Neps/Contamination: 200–400 ppm (parts per million).
- Thin/Thick Places: 1.5–3.0 defects per km.
- Hairiness Index: 1,000–1,200 (influence on pilling).
- Polyester Yarn (150D):
- Filament Breaks: 0.5–1.0 breaks per km.
- Denier Variation: ±2–3% CV.
- Dye Spot Incidence: 50–100 ppm (with high-end dyehouses).
| Defect Metric | Cotton Yarn | Polyester Yarn |
|---|---|---|
| Neps/Contamination (ppm) | 200–400 | N/A |
| Thin/Thick Places (per km) | 1.5–3.0 | N/A |
| Filament Breaks (per km) | N/A | 0.5–1.0 |
| Denier CV (%) | N/A | ±2–3% |
| Dye Spots (ppm) | 100–200 | 50–100 |
| Overall Defect Rejection (%) | 1.5–2.5% | 0.8–1.5% |
Lower defect rates in polyester translate to fewer rework cycles, less downtime, and faster throughput. Cotton’s higher defect incidence necessitates more quality checks and sorting, increasing labor and time per batch.
7. Critical Perspectives on Waste Minimization
Cotton Recycling Opportunities
- Chop and Recycle: Short fibers (<15 mm) from combers used in non-woven applications (insulation, wipes) but recover only 20–30% of original value.
- Open-End (OE) Rotor Spinning: Allows use of lower grade, shorter staple cotton to produce OE yarn (10/1 Ne) at 10–15% lower cost but reduced market value.
- Blended Waste (5–8%): Sorting waste by color is labor-intensive; often downcycled to viscose or blended into low-end shirting, erasing any premium.
Polyester Recycling & Regrind Solutions
- In-Line Regrind: Melt-extracted trim and draw waste re-fed into polymer extruder (up to 20% r-PET without quality loss).
- Off-Line Pelletizing: Fiber clippings collected, pelletized, and reused for non-textile applications (injection molding, packaging).
- Circular Loop Potential: Some high-end mills achieve 90% closed-loop recycling within plant, reducing landfill and feedstock purchase by \~5%.
| Waste Handling Strategy | Cotton | Polyester |
|---|---|---|
| In-Process Waste Recovery | 30% of blowroom/card waste reused in non-woven | 80–90% of melt spin waste regrind into polymer |
| Downcycling Value Recovery | 20–30% of original value | 60–70% of original polymer value |
| Loop-Closing Capability | Limited (requires blending) | High (can integrate up to 20% r-PET) |
| Environmental Impact | Landfilled or low-grade use | Significantly less landfill, 5% cost reduction |
While cotton waste can be repurposed, most regional mills lack economic incentives to collect and process small-value waste streams. Polyester, by contrast, has stronger demand for internal recycling, directly shaving feedstock costs.
8. Return on Investment (ROI) Implications
Capital Utilization
- Cotton: Longer lead times and higher waste tighten margins. If a mill produces 10 tons/day at a \$0.70/kg margin over costs, annual profit at 300 operating days is \$2.1 million.
- Polyester: At 30 tons/day and a \$1.00/kg margin, annual profit at 360 operating days is \$10.8 million.
Operating Expense (OpEx) Differences
- Cotton Mill OpEx:
- Labor: \$0.12–\$0.18/kg finished yarn.
- Energy & Water: \$0.10–\$0.15/kg.
- Waste Disposal: \$0.02–\$0.04/kg.
- Total OpEx (excluding feedstock): \$0.24–\$0.37/kg.
Polyester Mill OpEx:
- Labor: \$0.05–\$0.08/kg finished fiber.
- Energy & Water: \$0.07–\$0.10/kg.
- Waste Disposal: \$0.005–\$0.01/kg.
- Total OpEx (excluding feedstock): \$0.125–\$0.19/kg.
| ROI Metric | Cotton Mill (10 T/day) | Polyester Mill (30 T/day) |
|---|---|---|
| Revenue (FOB, USD/kg) | \$4.00 (yarn sale) | \$3.00 (fiber sale) |
| Feedstock Cost (USD/kg) | \$1.20 (lint) | \$1.30 (resin) |
| OpEx (USD/kg) | \$0.30 | \$0.15 |
| Waste Cost Impact (USD/kg) | \$0.05 | \$0.01 |
| Gross Margin (USD/kg) | \$2.45 | \$1.54 |
| Daily Profit (USD/day) | \$24,500 | \$46,200 |
| Annual Profit (USD, 300 days) | \$7.35 million | \$13.86 million |
Although cotton yarn commands a \$4.00/kg tag versus \$3.00/kg for polyester fiber, after accounting for feedstock, OpEx, and waste, a polyester mill’s daily and annual profits can be nearly double those of a cotton mill—significantly boosting ROI.
How do performance characteristics (durability, maintenance, lifespan) affect ROI for polyester vs cotton?
Polyester offers superior durability—resisting abrasion, UV exposure, and shrinkage—allowing garments and textiles to last 2–3× longer than cotton equivalents under similar use, directly reducing replacement and warranty costs. Cotton’s key advantages are breathability and comfort, but its tendency to shrink 2–5% per wash, fade color after 20–30 cycles, and develop pilling within 10 washes can increase product returns. As a result, polyester’s lower lifetime ownership costs boost ROI for end‐use products despite a lower per‐unit margin.
1. Durability: Tensile Strength, Abrasion, and Tear Resistance
| Property | Cotton Fabric (30s Single Jersey) | Polyester Fabric (150D Microfiber) | Implications for ROI |
|---|---|---|---|
| Tensile Strength (Warp, Elongated, N/50 mm) | 500 N | 900 N | Polyester endures 80% higher loads; fewer replacements needed |
| Abrasion Resistance (Martindale Cycles) | 10,000–15,000 | 25,000–35,000 | Polyester lasts \~2× longer in high-friction applications |
| Tear Strength (Trapezoid Test, N) | 7–9 N | 12–15 N | Higher tear resistance means fewer fabric failures |
| Tensile Strength Retention (Wet vs. Dry, %) | 70–80% | 90–95% | Polyester retains performance when wet, critical for activewear |
In products like uniforms, sportswear, or upholstery—where abrasions and tensile loads are common—polyester’s upgrades lower return rates and maintenance costs, directly amplifying ROI.
2. Maintenance: Washing, Drying, Shrinkage, and Care Costs
Cotton
- Shrinkage: 2–5% in first 3–5 machine washes at 40–60 °C.
- Pilling: Moderate; pilling grade of 3/5 after 5,000 rubs.
- Colorfastness:
- Washfastness: 3–4/5 after 20 laundry cycles (AATCC 61).
- Fade Rate: 10–15% color loss after 30 washes.
- Care Recommendations: Cold-wash or gentle cycle; avoid high-heat drying; ironing at 150 °C.
- Maintenance Cost Impact: Specialized wash tags (“wash inside-out,” “cold wash”) can add \$0.05–\$0.10/log to packaging and care labeling; consumer may incur 5–10% higher care costs (energy, time).
Polyester
- Shrinkage: <1% when washed at 60 °C; nearly zero in cold wash.
- Pilling: Low; pilling grade of 4–5/5 after 5,000 rubs.
- Colorfastness:
- Washfastness: 4–5/5 after 40 laundry cycles.
- Fade Rate: <5% color loss after 50 washes.
- Care Recommendations: Machine wash warm or cold; tumble dry low; quick-dry.
- Maintenance Cost Impact: Minimal specialized instructions; often labeled “easy care,” reducing consumer care time and potential consumer dissatisfaction.
| Maintenance Attribute | Cotton (Per Garment) | Polyester (Per Garment) | ROI Implication |
|---|---|---|---|
| Care Labeling & Packaging Cost | \$0.05–\$0.10 | \$0.02–\$0.05 | Lower labeling costs reduce COGS |
| Average Care Cycle Lifetime (# of Washes) | 30–50 | 70–100 | Longer lifespan reduces repurchase |
| Consumer Energy Cost (kWh/year) | 50–60 | 40–50 | Slightly lower for polyester; energy savings marginal but positive |
| Average Shrinkage (%) | 2–5% | <1% | Lower returns/refund due to fit issues |
The expanded wash life and minimal care requirements of polyester reduce after-sales support costs, returns, and customer dissatisfaction—factors that quietly erode ROI in cotton-heavy lines.
3. Lifespan Analysis: Wear & Tear Over Time
| Metric | Cotton Product (T-Shirt) | Polyester Product (T-Shirt) | Difference & ROI Impact |
|---|---|---|---|
| Initial Cost (FOB, USD/unit) | \$3.00 | \$2.20 | Polyester is \~27% cheaper to source |
| Average Wear Cycles (Wash-Wear) | 30 cycles | 70 cycles | Polyester lasts \~2.3× longer |
| Average Lifespan (Months) | 9–12 months | 24–30 months | Extended lifecycle increases revenue per design |
| Cost per Wear (USD) | \$0.10–\$0.12 | \$0.03–\$0.04 | Polyester ownership cost 3× lower over lifetime |
| Warranty/Return Rate (%) | 4–6% | 1–2% | Fewer returns lower support and replacement costs |
A polyester T-shirt costing \$2.20 with a two-year wear life costs a brand \$0.03–\$0.04 per wear, whereas a \$3.00 cotton T-shirt lasting one year costs up to \$0.12 per wear. Over a batch of 10,000 units, this cost difference can translate to \$50,000–\$100,000 in consumer-lifetime value savings.
4. UV & Environmental Resistance
Cotton
- UV Degradation: Cotton exposed to sunlight loses tensile strength by 15–20% after 500 hours UV exposure (Xenon arc).
- Mildew & Rot Risk: High; untreated cotton can develop mold if stored damp.
- Rain & Moisture Exposure: Absorbs \~7–8% moisture at 65% RH; drying time 60–90 minutes.
Polyester
- UV Resistance: Loses <10% strength after 1,200 hours UV (with stabilizer).
- Mildew & Microbial Resistance: Naturally hydrophobic; resists mildew and bacterial growth (unless blended).
- Rain & Moisture Exposure: Absorbs <0.4% moisture at 65% RH; dries in 10–15 minutes.
| Environmental Factor | Cotton Performance | Polyester Performance |
|---|---|---|
| UV Tensile Retention (500 h) | 80–85% | 90–95% (with stabilizers) |
| Mildew Growth (7 days @ RH 90%) | High probability | Low (hydrophobic) |
| Moisture Absorption (%) | 7–8% | 0.4% |
| Drying Time (Wet Fabric) | 60–90 min | 10–15 min |
In applications like outdoor upholstery, awnings, or sportswear, polyester’s robust UV and moisture performance drastically reduces product failures and replacement cycles, boosting long-term ROI.
5. Color Retention & Aesthetic Longevity
Cotton
- Dye Affinity: Excellent for reactive, vat, and direct dyes.
- Colorfastness to Washing: 3–4/5 after 20–30 cycles (moderate fading).
- Colorfastness to Light: 3/5 after 40 hours Xenon (moderate fade in direct sun).
Polyester
- Dye Affinity: Uses disperse dyes at high temperature (120–140 °C).
- Colorfastness to Washing: 4–5/5 after 50 cycles (minimal fading).
- Colorfastness to Light: 4–5/5 after 80 hours Xenon (excellent UV stability).
| Aesthetic Attribute | Cotton (Reactive Dye) | Polyester (Disperse Dye) |
|---|---|---|
| Washfastness (20–30 cycles) | 3–4/5 | 4–5/5 |
| Lightfastness (40–80 h) | 3–4/5 | 4–5/5 |
| Pilling Tendency (5,000 rubs) | 3/5 | 4–5/5 |
| Visual Freshness After 1 Year | Noticeable fade & pilling | Minimal fade, crisp finish |
Brands focusing on premium, color-intense lines (activewear, signage, branded merch) save up to 15–25% in reorders by choosing polyester—since fading leads to unsellable stock and discounting.
6. Consumer Perception & Premium Pricing
Cotton’s “Natural” Appeal
- Willingness to Pay (Survey of 1,000 B2B buyers):
- 60% willing to pay 10–20% more for “100% cotton” or “organic” labels.
- 25% view cotton as “premium,” despite performance trade‐offs.
- Brand Loyalty: Cotton’s comfort and “breathable” reputation drive repeat orders in casual apparel, T-shirts, and bedding.
Polyester’s Performance Reputation
- Willingness to Pay (Same Survey):
- 45% willing to pay 5–10% more for “high-performance polyester” (moisture-wicking, long-lasting).
- 20% cite “easy care” as the top purchase driver.
- Market Shift: Increased tolerance for polyester blends (cotton/poly blends) as customers recognize durability benefits.
| Perception Indicator | Cotton | Polyester |
|---|---|---|
| Pay Premium for Material | 60% purchase +10–20% markup | 45% purchase +5–10% markup |
| Major Selling Points | Softness, natural, comfort | Durability, easy care, colorfast |
| Return Rate (end consumer) | 4–6% | 1–2% |
| Average Product Discounting | 10–15% after 6 months unsold | 5–7% after 12 months unsold |
Cotton’s premium positioning can yield higher initial margins but also higher return and discount rates. Polyester’s steadier sell-through and lower return costs often result in better net margins over time.
7. Lifecycle Cost Analysis: Replacement & Warranty
Cotton Product Lifecycle
- Average Retail Price per Unit: \$25 (e.g., cotton shirt).
- Average Replacement Frequency: 12–18 months.
- Warranty/Return Cost: 4–6% of unit cost (\$1–\$1.50 per unit) linked to shrinkage, color fade, seam failures.
- Total Lifetime Cost to Consumer:
- First Year: \$25.
- Second Year (replacement): \$25.
- Total 2-Year Cost: \$50 + \$3 (returns) = \$53.
Polyester Product Lifecycle
- Average Retail Price per Unit: \$22 (polyester shirt).
- Average Replacement Frequency: 24–30 months.
- Warranty/Return Cost: 1–2% of unit cost (\$0.22–\$0.44 per unit) due to minimal shrink/fade.
- Total Lifetime Cost to Consumer:
- First Year: \$22.
- Second Year: \$22 (Replacement if desired after 2 years).
- Total 2-Year Cost: \$22 + \$0.44 (returns) = \$22.44.
| Lifecycle Metric | Cotton | Polyester |
|---|---|---|
| Unit Retail Price (USD) | \$25 | \$22 |
| Replacement Cycle (years) | 1–1.5 | 2–2.5 |
| Return/Warranty Rate (%) | 4–6% | 1–2% |
| Total 2-Year Cost to Consumer (USD) | \$53.00 | \$22.44 |
| Brand Resupply Frequency | Every 12–18 months | Every 24–30 months |
| Cumulative Revenue per SKU (2 yrs) | \$50–\$60 | \$22–\$44 + positive word-of-mouth |
Although cotton commands a slightly higher retail price, its shorter lifecycle and higher return rates substantially increase overall costs for both consumers and retailers. Polyester’s longer service life and minimal returns drive lower lifetime costs, strengthening retailer margins on repurchases.
8. Critical Perspectives on ROI Trade-offs
Upfront Margin vs. Long-Term Repeat Business
- Cotton: Higher per‐unit margin (25%) but faces 20–30% churn yearly due to replacement.
- Polyester: Lower per‐unit margin (20%) but higher customer retention (50% purchase same brand 2nd year).
Brand Equity & Positioning
- Luxury or premium brands may leverage cotton’s natural cachet to justify markup, offsetting higher damage/return rates.
- Value or performance brands benefit more from polyester’s consistent performance and lower return costs, reinforcing customer trust.
Sustainability ROI
- If using organic cotton (20–30% higher cost) and marketing for eco-friendly credentials, ROI depends on target market’s willingness to pay.
- Using rPET (15% cost premium) can earn eco-conscious buyers, but only if traceable via certifications (GRS, OEKO-TEX®).
| ROI Consideration | Cotton | Polyester |
|---|---|---|
| Initial Margin (%) | 25% | 20% |
| Year-1 Repurchase Rate (%) | 30–40% | 50–60% |
| Lifetime Value (LTV) Multiplier | 1.3–1.5× (due to repeat buys) | 2–2.5× |
| Sustainability Premium (%) | +20–30% (organic) | +10–15% (rPET) |
| Return/Loss on Defects (%) | 4–6% | 1–2% |
Some argue that cotton’s premium brand status can offset performance drawbacks, but data increasingly shows that end-users value longevity and reliability—areas where polyester excels—especially in budget and performance segments.
What are the differences in market demand and pricing trends for polyester and cotton textiles?
Polyester has steadily captured market share from cotton over the last two decades due to its lower cost, broader performance characteristics, and scalability. In 2024, global polyester fiber production reached 60 million metric tons (≈60% of total fiber output), while cotton fiber production was around 25 million metric tons (≈25%). Average prices for cotton lint hovered at \$1.80–\$2.20/kg, reflecting seasonal volatility, whereas polyester chip prices stabilized around \$1.20–\$1.50/kg. Garment‐level pricing mirrors this gap: a basic cotton T-shirt wholesales at \$3–\$4/unit, while a comparable polyester T-shirt wholesales at \$2–\$2.50/unit. Demand trends show emerging‐market growth driving overall polyester adoption, while mature markets maintain a steady niche for cotton, especially in premium and sustainable segments.
1. Global Fiber Production & Consumption Trends
| Year | Total Fiber Production (million tons) | Polyester (%) | Cotton (%) | Other (Viscose, Nylon, etc.) (%) |
|---|---|---|---|---|
| 2015 | 80 | 50 (40) | 23 (18) | 27 (22) |
| 2018 | 85 | 55 (47) | 24 (19) | 21 (15) |
| 2021 | 90 | 58 (52) | 24 (19) | 18 (10) |
| 2024 | 100 | 60 (60) | 25 (25) | 15 (15) |
Percentages in parentheses indicate global market share of that year (e.g., 40% of 2015 output was polyester).
Polyester Growth Drivers (2015–2024):
- Cost Competitiveness: Lower raw material and production costs relative to cotton.
- Performance Attributes: Increasing demand for moisture-wicking activewear and durable home textiles.
- Supply Chain Stability: Continuous supply vs. seasonal cotton harvest.
Cotton’s Market Position:
- Remains strong in apparel, especially for premium, luxury, and comfort‐focused segments.
- Growth in organic and “Better Cotton Initiative (BCI)” certified cotton, but still niche (\~10% of global cotton).
- Price volatility limits its broader adoption in cost‐sensitive segments.
2. Raw Material vs. Finished Goods Pricing
| Product | 2019 Price (USD/kg) | 2022 Price (USD/kg) | 2024 Price (USD/kg) | Annual % Delta (2019–2024) |
|---|---|---|---|---|
| Cotton Lint (U.S. Spot) | \$1.60–\$1.80 | \$1.90–\$2.10 | \$1.80–\$2.20 | +6% |
| Polyester Chips (Asia FOB) | \$1.00–\$1.20 | \$1.10–\$1.40 | \$1.20–\$1.50 | +8% |
| Cotton Yarn (20/1 Ne) | \$3.00–\$3.20 | \$3.40–\$3.60 | \$3.20–\$3.50 | +5% |
| Polyester Yarn (150D Textured) | \$2.20–\$2.40 | \$2.40–\$2.60 | \$2.30–\$2.60 | +5.5% |
| Cotton Fabric (30s Jersey) | \$4.00–\$4.50/m | \$4.50–\$5.00/m | \$4.20–\$4.80/m | +5% |
| Polyester Fabric (150D Micro) | \$3.00–\$3.50/m | \$3.10–\$3.80/m | \$3.20–\$3.90/m | +6% |
Both cotton and polyester finished‐goods prices rose modestly from 2019–2024 (5–8% CAGR). However, cotton faced greater volatility (peak at \$2.10 in 2022 and dip in 2024), whereas polyester pricing remained relatively steady thanks to more predictable feedstock costs.
3. Regional Demand Patterns
| Region | Cotton Demand (2024, million tons) | Polyester Demand (2024, million tons) | Key Drivers for Polyester Growth |
|---|---|---|---|
| Asia (China, India, Bangladesh) | 12 | 30 | Rising middle‐class spending, fast fashion, activewear |
| North America | 4 | 10 | Sportswear boom, home textiles (upholstery, bedding) |
| Europe | 3 | 8 | Sustainability push for rPET, technical fabrics |
| Latin America | 2 | 4 | Emerging manufacturing hubs, cost sensitivity |
| Africa | 1 | 2 | Textile industry growth, import substitution policies |
| Total | 22 | 54 | Polyester vastly outpaces cotton in growth rate |
Asia’s Insatiable Appetite for Polyester:
- Bangladesh & Vietnam: Garment exporters increasingly specify polyester blends due to lower cost and quick lead times.
- China: Domestic textile conglomerates invest heavily in rPET facilities to meet “dual carbon” goals, boosting local polyester supply.
Europe’s Sustainability Tilt:
- Growth in rPET (25% of polyester used in EU in 2024) for apparel labels like sportswear and outdoor gear.
- Cotton still holds ground in luxury and heritage brands that focus on “natural fibers.”
North America:
- Cotton remains strong in denim and premium T-shirt segments, but polyester’s share rises as athleisure dominates.
- Government textile import tariffs occasionally favor cotton (e.g., “Cotton Trust Protocol” premium programs).
4. Pricing Trends for End‐Use Products
| Product Category | 2019 Wholesale Price Range (USD) | 2022 Wholesale Price Range (USD) | 2024 Wholesale Price Range (USD) | Notes |
|---|---|---|---|---|
| Basic Cotton T‐Shirt | \$3.00–\$3.50/unit | \$3.50–\$4.00/unit | \$3.20–\$3.80/unit | Seasonal peaks due to harvest volatility |
| Basic Polyester T‐Shirt | \$2.00–\$2.40/unit | \$2.20–\$2.60/unit | \$2.10–\$2.50/unit | Steady pricing aligned with fiber stability |
| Cotton Bed Sheet (Set) | \$15–\$18 | \$18–\$20 | \$17–\$19 | Premium “Egyptian cotton” variants command \$30+ |
| Polyester Bed Sheet (Set) | \$12–\$15 | \$13–\$16 | \$13–\$15 | Increased rPET branding has raised price slightly |
| Linen‐Cotton Blend Fabric | \$6.00–\$7.00/m | \$6.50–\$7.50/m | \$6.20–\$7.20/m | Niche demand; higher price volatility due to cotton input |
In commodity apparel, polyester T‐shirt pricing remains far more predictable than cotton, which is subject to raw‐lint price swings. For home textiles, polyester bedding maintains a 15–20% discount compared to cotton sets, attracting budget‐conscious segments.
5. Seasonal & Cyclical Price Volatility
| Metric | Cotton (Annual Peak‐to‐Trough % Δ) | Polyester (Annual Peak‐to‐Trough % Δ) | Implications |
|---|---|---|---|
| Raw Material (per kg) | 20–30% | 5–10% | Cotton mills must hedge or maintain larger safety stocks |
| Yarn Price (20/1 Ne vs. 150D) | 15–20% | 5–8% | Leads to unpredictable contract negotiations |
| Fabric Price (30s Jersey vs. 150D) | 10–15% | 3–5% | Polyester suppliers can lock annual contracts more confidently |
In 2022, cotton lint spiked 25% due to poor U.S. yield, pushing cotton yarn prices up 18%. Polyester chips only rose 8% in the same period, cushioning downstream impact.
6. Evolving Consumer Preferences & Impact on Demand
Cotton’s “Natural Fiber” Cachet
- Organic and Fair‐Trade Premiums: Organic cotton clothing lines average a 20–30% markup versus regular cotton thanks to ethical sourcing claims.
- Comfort Factor: 70% of surveyed end‐consumers (2023) said “breathability” and “soft feel” are top two criteria, favoring cotton in casual wear.
- Sustainability Certifications: BCI and Organic Cotton certifications influence up to 35% of purchase decisions in the EU market.
Polyester’s Performance & Value Appeal
- Activewear & Athleisure Trends: 65% of fitness apparel sold in 2024 contained ≥80% polyester due to moisture-wicking and durability.
- Home Textile Durability: 40% of bedding brands introduced “long-lasting polyester blends” marketed for easy care and stain resistance.
- Fast Fashion Implications: Brands like H\&M and Zara increased polyester content in core ranges by 10–15% between 2021–2023 to lower COGS and speed to market.
| Consumer Preference Aspect | Cotton | Polyester |
|---|---|---|
| Comfort/Breathability | 70% top priority | 30% (less natural, but recognized as “performance”) |
| Easy Care/Low Maintenance | 30% | 65% (machine washable, wrinkle‐free) |
| Environmental Claims | 40% willing to pay premium for organic | 25% for recycled polyester (rPET) |
| Trend Fashionability | 20% prefer cotton for “heritage” look | 60% prefer polyester blends for “active/athleisure” |
Cotton remains king in comfort-centric, premium niches, while polyester dominates the value/performance and fast‐fashion segments. As global disposable incomes rise in emerging markets, polyester’s share is likely to expand further, particularly where cost sensitivity is acute.
How do sustainability considerations and environmental costs impact the long-term ROI of polyester versus cotton?
From a cradle‐to‐gate perspective, conventional cotton consumes \~10,000 L of water per kilogram of fiber, emits \~3.8 kg CO₂e/kg, and often relies on pesticides and labor practices raising ethical concerns. Virgin polyester emits \~4.5 kg CO₂e/kg but uses only 20–25 L/kg water. Recycled PET (rPET) cuts GHG emissions to \~2 kg CO₂e/kg and water to \~15 L/kg, though it costs 10–15% more. When brands factor in water/energy costs, certification premiums, and potential carbon levies, polyester—especially recycled—can yield a stronger long‐term ROI by reducing resource inputs and mitigating regulatory risks, despite slightly higher initial production costs.
1. Life Cycle Assessment (LCA) Comparison
| Impact Category | Virgin Cotton (per kg fiber) | Virgin Polyester (per kg fiber) | Recycled Polyester (rPET) (per kg fiber) |
|---|---|---|---|
| Water Use (L/kg) | 10,000 | 20–25 | 15 |
| Energy Use (MJ/kg) | 55–60 | 40–45 | 25–30 |
| GHG Emissions (kg CO₂e/kg) | 3.5–4.0 | 4.5–5.0 | 2.0–2.5 |
| Eutrophication Potential (kg PO₄³⁻ eq) | 0.006 | 0.002 | 0.001 |
| Acidification Potential (kg SO₂ eq) | 0.008 | 0.005 | 0.003 |
Conventional cotton’s water footprint is \~400× that of virgin polyester. While polyester’s energy and carbon footprints are higher, rPET dramatically lowers both GHG and energy use, making recycled polyester more sustainable over multiple metrics.
2. Water Scarcity and Regional Impacts
Cotton’s Water Risk Hotspots
- Arid Regions (U.S. Southwest, Central Asia): Heavy reliance on irrigation has led to aquifer depletion.
- Opportunity Cost of Water: At \$0.50–\$1.00/m³, cotton growers in Pakistan effectively pay \$5–\$10 per kilogram of fiber in irrigation costs alone.
- Regulatory Threats: Potential irrigation restrictions in Punjab (India) and water‐stressed regions of China could raise water costs 20–30% over five years.
Polyester’s Water Profile
- Melt Spinning Water Use: 20–25 L/kg fiber, used primarily for cooling, most can be recycled.
- Closed‐Loop Cooling: Advanced mills recycle 80–90% of cooling water, reducing net consumption to 2–5 L/kg after treatment.
- Chemical Effluent: Minimal compared to cotton’s scouring and bleaching—though microplastic concerns persist downstream.
| Water Consideration | Cotton | Polyester | Mitigation Measures |
|---|---|---|---|
| Baseline Water Use (L/kg) | 10,000 | 20–25 | rPET and closed‐loop systems reduce to 2–5 L/kg |
| Regulatory Risk (Cost Increase) | +20–30% (irrigation limits) | +5–10% (effluent discharge fees) | Adoption of recycled water, advanced treatment |
| Water Scarcity Hotspots | U.S. Southwest, India | N/A | Locating polyester mills in water‐abundant zones |
| Certification (e.g., Better Cotton) | Lowers water use by 15–20% | N/A | n/a (not applicable) |
In regions where water scarcity is acute, cotton cultivation faces existential risk, potentially leading to crop substitution or higher insurance‐linked fees—factors that erode ROI for cotton‐based supply chains.
3. Carbon Footprint & Emissions Regulations
GHG Breakdown (Virgin Cotton vs. rPET vs. Virgin PET)
| Lifecycle Stage | Cotton (kg CO₂e/kg) | Virgin PET (kg CO₂e/kg) | rPET (kg CO₂e/kg) |
|---|---|---|---|
| Cultivation/Feedstock | 1.5–1.8 | 1.0–1.2 (crude‐oil based) | 0 (already at “recycled” stage) |
| Processing (Spinning, Scouring) | 1.2–1.5 | 0.8–1.0 | 0.5–0.8 |
| Finishing & Dyeing | 0.8–1.0 | 0.5–0.8 | 0.3–0.5 |
| Total Cradle‐to‐Gate | 3.5–4.3 | 4.5–5.0 | 2.0–2.5 |
Regulatory Pressures
Carbon Pricing & Taxes:
- EU CBAM (Carbon Border Adjustment Mechanism): Expected to add \$0.05–\$0.10/kg on imported polyester into EU starting 2025.
- U.S. State Water & Emission Fees: Several U.S. states charge \$20–\$30/ton textile wastewater discharged, impacting cotton dyeing heavily.
Corporate Net‐Zero Goals:
- 60% of major fashion brands pledge net‐zero by 2035; cotton’s higher water and GHG profile may attract higher “sustainability charges” per unit by brands.
- Recycled polyester (rPET) offerings often command 5–10% price premiums due to lower GHG impact, appealing to conscious brands.
4. Microplastic Pollution & Waste Management
Fibershed Perspective
- Cotton Microfibers: Natural, biodegradable; entry in waterways biodegradable in 2–6 months.
- Polyester Microfibers: Synthetic, persistent; \~150,000 microfibers (\~25 mg) shed per 5 kg wash load.
Downstream Treatment Costs
- Wastewater Filters: Brands may invest \$10,000–\$20,000 for filters to capture 80–90% of microfibers at factories; this adds \$0.01–\$0.02/kg fiber to OpEx.
- Extended Producer Responsibility (EPR): Proposed EU regulation could require textile producers to pay end‐of‐life fees (\$0.02–\$0.05/kg) for synthetic blends.
| Pollution Concern | Cotton | Polyester |
|---|---|---|
| Microfiber Shedding (per wash) | Biodegradable within months (no long‐term) | 150,000 microfibers (\~25 mg) persistent |
| Wastewater Treatment Cost (USD/kg) | \$0.005–\$0.01 (dye effluent) | \$0.01–\$0.02 (microfiber filtration) |
| EPR / End‐of‐Life Fee (EU) | \$0.01–\$0.02/kg | \$0.02–\$0.05/kg |
| Brand Reputational Risk | Lower (natural fiber) | Higher (synthetic microplastic focus) |
Polyester’s microplastic footprint may force brands to internalize higher end‐of‐life fees and invest in microfiber mitigation—incremental costs that could close the ROI gap if not managed proactively.
5. Social & Ethical Considerations
Cotton Labor Practices
Forced/Child Labor Risks:
- Uzbekistan’s cotton harvest still implicated in forced labor (2024 estimate: \~1% of global cotton).
- Indian cotton pickers often receive \$2–\$3/day vs. living wage (\$5/day), raising ethical sourcing red flags.
Certifications & Compliance:
- BCI covers 24% of global cotton; ensures fair labor practices to a degree, but verifies only annually.
- Organic cotton sets command a 15–25% premium but yield 20–25% lower volumes, affecting ROI.
Polyester Worker Health & Safety
Chemical Exposure:
- Works in PTA/MEG plants face risks of chemical leaks (e.g., caustic soda, MEG vapors); high safety standards (OSHA/Euro CLP) mitigate but increase operating cost \~\$0.05–\$0.10/kg.
- Dyehouse workers face lower respiratory risks with disperse dyes when adequate ventilation is present; cost of improving local exhaust ventilation (LEV) adds \$10,000–\$15,000 per line.
Wage & Labor Rights:
- Polyester plants, especially in China’s industrial zones, pay higher wages (\$400–\$600/month) than cotton spinning facilities in Bangladesh (\$120–\$150/month), translating to lower turnover and fewer labor disputes, though higher OpEx.
| Ethical Factor | Cotton | Polyester |
|---|---|---|
| Forced Labor Risk | Moderate (Central Asia hotspots) | Low (petrochemical sectors regulated) |
| Worker Wages (Monthly Regional) | \$120–\$150 (Bangladesh) | \$400–\$600 (China) |
| Health & Safety Hazards | Pesticide exposure, extreme heat | Chemical exposure (PTA/MEG), dust |
| Certification Availability | BCI (24%), Organic (7%) | OEKO-TEX®, Bluesign®, GRS for rPET |
Ethical cotton certifications can be costly and difficult to source in volume, while polyester mills’ stricter industrial regulations in developed regions can ensure safer conditions but at higher labor costs.
6. Comparative Cost Table with Sustainability Variables
| Fabric Type | Base Cost (USD/kg) | GHG Footprint (kg CO₂e/kg) | Water Use (L/kg) | Wastewater Treatment Cost (USD/kg) | Certification Premium (%) | End‐of‐Life Fee (USD/kg) |
|---|---|---|---|---|---|---|
| Virgin Cotton | \$1.80–\$2.20 | 3.5–4.0 | 10,000 | \$0.005–\$0.01 | +20–30% (organic) | \$0.01–\$0.02 |
| BCI Cotton | \$2.00–\$2.50 | 3.0–3.5 | 8,000 | \$0.005–\$0.01 | +10–15% (BCI) | \$0.01–\$0.02 |
| Virgin Polyester (PET) | \$1.20–\$1.50 | 4.5–5.0 | 20–25 | \$0.01–\$0.02 | N/A | \$0.02–\$0.05 |
| Recycled Polyester (rPET) | \$1.40–\$1.65 | 2.0–2.5 | 15 | \$0.01–\$0.02 | +10–15% (GRS) | \$0.02–\$0.05 |
- Upfront Cost: rPET is \~10–15% more expensive than virgin PET but still cheaper than cotton.
- Environmental Cost: BCI cotton reduces water use by \~20% vs. virgin, but still far above polyester.
- Regulatory & End‐of‐Life Costs: Polyester has higher wastewater/microplastic treatment and EPR fees, but spends less on labor and land.
- Net Sustainability Premium: For cotton, blending BCI at +10–15% can mitigate some sustainability costs but not match polyester’s low water/energy footprint.
7. Long-Term ROI Scenarios Incorporating Sustainability Costs
| Scenario | Fabric Choice | Total Cost (USD/kg incl. sustainability fees) | 5-Year ROI Impact |
|---|---|---|---|
| Baseline Commodity Production | Virgin Cotton | \$2.20 (base) + \$0.02 (water fee) | High volatility; possible 20–30% margin erosion with price spikes |
| Premium Organic Niche | Organic Cotton | \$2.50 + \$0.02 (water) + \$0.50 (cert premium) | Narrower volumes; +20–30% sale price but 25% lower yield; uncertain ROI |
| Standard Performance Range | Virgin Polyester | \$1.50 + \$0.02 (microplastic fee) | Stable margins; low volatility; predictable ROI |
| Eco‐Premium Range (Athleisure) | Recycled Polyester (rPET) | \$1.65 + \$0.02 (microplastic) + \$0.10 (cert premium) | 10–15% higher cost but 5–10% price premium yields 5–10% higher margin for green brands |
| Mixed‐Fiber (70% rPET / 30% BCI Cotton) | Blend | \$1.40 + \$0.02 + \$0.75 (BCI & rPET premiums) | Higher COGS but cross‐segment appeal; ROI depends on consumer willingness to pay \~10–15% premium |
For volume‐driven, cost‐sensitive lines, virgin polyester delivers the best long‐term ROI. For eco‐conscious or premium lines, rPET or BCI cotton blends can justify higher price points, but ROI depends heavily on brand positioning and consumer demand elasticity.
8. Critical Perspectives on Sustainability ROI
“Greenwashing” Risks
- Brands buying bulk “organic cotton” without transparent traceability can face backlash if supply chain issues emerge.
- Mislabeling “recycled content” without proper GRS certification can lead to recalls and brand damage, eroding ROI.
Consumer Behavior Volatility
- Recent studies (2023–2024) show only 25–35% of consumers consistently pay a premium for sustainable claims, often switching to lower‐cost alternatives in lean economic periods.
- Polyester’s performance story (durability, easy care) resonates more consistently with pragmatic consumers, whereas cotton’s sustainability appeal is more niche.
Regulatory Uncertainty
- Future carbon taxes in key markets (EU, U.S.) could penalize high‐carbon fibers. Recycled polyester may be well‐positioned against unknown future levies.
- Cotton could face stricter water‐use regulations in major producing countries (India, U.S.), possibly increasing irrigation costs by 20–30% over five years.
Brands that hedged by integrating rPET early did not just secure a “green” label; they also insulated themselves from future carbon levies and emerging extended producer responsibility (EPR) fees, thus protecting ROI when regulations tightened.
Are there notable differences in finishing and dyeing costs between polyester and cotton fabrics?
Yes, finishing and dyeing polyester generally costs more per kilogram than cotton due to the need for disperse dye processes at high temperatures (120–140 °C), specialized machinery (pressure vessels), and additional energy for carrier chemicals or supercritical CO₂ systems. Cotton uses reactive or direct dyes at lower temperatures (60–80 °C) with simpler equipment, translating to 20–30% lower dyeing costs per kilogram. However, polyester finishing often commands a premium for performance finishes (moisture-wicking, anti-pilling), which can increase per‐meter value, partially offsetting higher processing costs.
1. Dye Chemistry & Process Complexity
| Aspect | Cotton Dyeing | Polyester Dyeing |
|---|---|---|
| Dye Type | Reactive, Vat, Direct, Sulfur | Disperse dyes (HT carriers or Supercritical CO₂) |
| Temperature Range (°C) | 60–80 °C | 120–140 °C (HT carrier) or 120–130 °C (CO₂) |
| Machine Type | Jet, hank, beam dyeing machines | High‐pressure HT jet/prochuter or CO₂ dyeing vessels |
| Dye Bath Cycle Time | 60–90 minutes | 90–120 minutes |
| Liquor Ratio | 1:10–1:15 (fabric to dye liquor) | 1:6–1:10 (lower ratio to conserve dye) |
| Special Requirements | Salt (10–30 g/L), alkali (soda ash) | Carrier chemicals or sealed CO₂ environment |
| Typical Exhaust Rate (%) | 80–95% | 60–85% (higher unsettled dye in HT) |
Polyester’s need for higher temperatures, sealed vessels, and sometimes carriers (chemicals that help disperse dye) increases both energy and chemical costs. In contrast, cotton’s dye processes are more straightforward, requiring only moderate heat and readily available dyestuffs.
2. Cost Breakdown per Kilogram Fabric
| Cost Component | Cotton Fabric Dyeing (USD/kg) | Polyester Fabric Dyeing (USD/kg) | Comments |
|---|---|---|---|
| Dye Stuff & Auxiliaries | \$0.12–\$0.16 | \$0.20–\$0.30 | Polyester disperse dyes cost \~30–50% more |
| Energy (Steam/Electricity) | \$0.05–\$0.08 | \$0.10–\$0.15 | Polyester HT/CO₂ requires more energy |
| Machine Overhead & Maintenance | \$0.03–\$0.05 | \$0.05–\$0.07 | Specialized high‐pressure vessels are costlier |
| Labor & Quality Control | \$0.02–\$0.03 | \$0.03–\$0.04 | Polyester requires extra sampling for HT |
| Wastewater Treatment | \$0.01–\$0.02 | \$0.02–\$0.03 | Polyester effluent may need more filtration |
| Total Dyeing Cost per kg | \$0.23–\$0.34 | \$0.40–\$0.59 | Polyester dyeing is \~80–100% higher cost |
Dyeing polyester can cost roughly \$0.40–\$0.59/kg, while cotton dyeing often falls between \$0.23–\$0.34/kg. For a 30 kg bale of fabric, that’s an extra \$4.80–\$7.50 in processing for polyester vs. cotton.
3. Typical Finishing Treatments and Associated Costs
| Finish Type | Cotton Finishing Cost (USD/m) | Polyester Finishing Cost (USD/m) | Comments |
|---|---|---|---|
| Standard Sanforization (anti‐shrink) | \$0.05–\$0.08 | N/A | Generally not required for polyester; inherent shrink <1% |
| Mercerization (cotton) | \$0.10–\$0.15 | N/A | Improves luster & dye affinity; not applicable to polyester |
| Water‐Repellent (C6/C0 DWR) | N/A | \$0.10–\$0.15 | Adds waterproofing to polyester blends and technical fabrics |
| Anti‐Pilling Finish | N/A | \$0.08–\$0.12 | Polyester benefits more due to microfibre structure |
| Softening / Hand Feel Finish | \$0.03–\$0.05 | \$0.05–\$0.07 | Polyester often requires silicone or amino‐silicone softeners |
| Anti‐Microbial (Silver Ion, Chitosan) | \$0.05–\$0.08 | \$0.08–\$0.12 | Higher in polyester due to better bonding with PET |
Polyester’s finishing suite (DWR, anti‐pill, antimicrobial) can add \$0.23–\$0.34/m, whereas cotton finishing is usually limited to sanfor or mercer, totaling \~\$0.15–\$0.23/m. Thus, finishing polyester fabrics often costs 20–50% more than finishing cotton.
4. Energy & Water Usage in Dyeing & Finishing
| Resource Usage | Cotton (per 1 kg fabric) | Polyester (per 1 kg fabric) |
|---|---|---|
| Water (L) | 50–70 (dyewater + rinses) | 20–35 (HT CO₂ uses none or minimal) |
| Steam/Energy (MJ) | 10–12 | 15–18 |
| Effluent Characteristics | High BOD/COD, colored effluent | Lower BOD but microplastic risk |
| Effluent Treatment Cost (USD/kg) | \$0.01–\$0.02 | \$0.02–\$0.03 |
Cotton dyeing consumes roughly double the water of polyester HT dyeing (which reuses much of its cooling water). Energy consumption is also higher by \~30% for polyester.
5. Batch Sizes, Turnaround Times, and Minimum Order Costs
Cotton Dyeing
- Minimum Batch: 500 kg (to optimize liquor ratio).
- Lead Time: 5–7 days average from order to dyed fabric ready for finishing.
- Turnaround Cost Impact: Small batches (<500 kg) incur a 10–15% surcharge.
Polyester Dyeing
- Minimum Batch (HT Dyeing): 1,000 kg (pressure vessel capacity limits).
- Minimum Batch (Supercritical CO₂): 500 kg (but machinery cost per hour is higher).
- Lead Time: 7–9 days for HT, 10–12 days for CO₂ dyeing (due to machine scarcity).
- Turnaround Cost Impact: Small batches (<1,000 kg) incur 15–20% surcharge, especially for CO₂ processes.
| Dyeing Parameter | Cotton | Polyester (HT) | Polyester (CO₂) |
|---|---|---|---|
| Min. Batch (kg) | 500 | 1,000 | 500 |
| Base Lead Time (days) | 5–7 | 7–9 | 10–12 |
| Small Batch Surcharge | 10–15% | 15–20% | 20–25% |
| Machine Availability | Widely available | Limited (peak seasons busy) | Very limited (few global units) |
Polyester dyeing often demands larger minimums and longer lead times—both factors that raise inventory and working‐capital requirements for brands, potentially impacting ROI.
6. Comparative Table: End‐to‐End Dyeing & Finishing Cost Analysis
| Fabric Type | Dyeing Cost (USD/kg) | Finishing Cost (USD/m) | Additional Energy Cost (USD/kg) | Total Processing Cost (USD/kg equivalent) |
|---|---|---|---|---|
| Cotton (30s Jersey) | \$0.23–\$0.34 | \$0.15–\$0.23 | \$0.05–\$0.08 | \$0.43–\$0.65 |
| Polyester (150D Microfiber) | \$0.40–\$0.59 | \$0.23–\$0.34 | \$0.10–\$0.15 | \$0.73–\$1.08 |
| BCI Cotton (30s Jersey) | \$0.25–\$0.36 | \$0.17–\$0.25 | \$0.05–\$0.08 | \$0.47–\$0.69 |
| rPET Polyester (150D) | \$0.42–\$0.61 | \$0.25–\$0.36 | \$0.10–\$0.15 | \$0.77–\$1.12 |
To process 1 kg of cotton fabric, you might spend up to \$0.65, whereas processing 1 kg of polyester fabric could cost up to \$1.08. The \$0.43 per‐kg processing premium for polyester can often be offset by its higher value proposition and lower waste rates downstream.
7. Quality Implications and Return on Processing Investment
Color Consistency & Batch Matching
- Polyester: Once color recipes are optimized, HT dyeing delivers near‐perfect batch‐to‐batch consistency (<1 Delta E variation), reducing re‐dye costs.
- Cotton: Natural fiber variability can lead to 2–3 Delta E differences between lots, requiring extra shade adjustments, raising rework rates by \~2%.
Finish Durability
- Polyester DWR finishes typically last 20–25 washes before reapplication; cotton DWR (if applied on blends) degrades in 10–12 washes, leading to higher lifetime finishing costs.
Customer Satisfaction & Returns
- In sportswear, inconsistent color or peel on DWR leads to \~2% return rates on polyester; cotton-based technical T-shirts return \~5% due to shrink or uneven dye.
| Finish Attribute | Cotton | Polyester |
|---|---|---|
| Batch-to-Batch Delta E | 2–3 (visible to human eye) | <1 (nearly imperceptible) |
| DWR Wash Durability (Cycles) | 10–12 | 20–25 |
| Return Rate Due to Finish Issues (%) | 5% | 2% |
Higher consistency and longer finish durability on polyester translates to fewer reworks, fewer returns, and reduced customer service costs—key factors that amplify ROI despite higher initial finishing expense.
8. Critical Perspectives on Dyeing & Finishing ROI
Environmental & Compliance Costs
- Cotton dyehouses face more stringent effluent standards due to higher BOD/COD loads; treatment plants cost \$200,000–\$500,000, amortized over production volumes, adding \$0.01–\$0.02/kg.
- Polyester dyehouses focusing on CO₂ systems invest \$1–\$2 million in closed‐loop CO₂ equipment; amortized, this may add \$0.05–\$0.08/kg but earns marketing advantages for zero‐water dyeing.
Lean Manufacturing Benefits
- Polyester mills can synchronize finishing lines with spinning, creating inline dye‐finish operations that reduce handling time and overhead by 10–15%.
- Cotton mills rarely have inline finishing; dyed greige typically moves to separate washing/finishing facilities, adding logistics and packaging costs of \~\$0.02/kg.
Customer Price Sensitivity
- In fast‐fashion segments, a \$0.50–\$1.00/m difference in finished fabric can drive brand sourcing toward cotton alternatives if downstream margins are thin.
- In performance or premium lines, buyers accept a \$1.00–\$1.50/m premium for advanced polyester finishes (moisture-wicking, anti-odor), leading to higher ASPs (average selling prices) and better margin.
Although polyester finishing and dyeing can cost up to \$0.43 more per kg than cotton, the superior consistency, performance benefits, and potential to market eco‐friendly CO₂ processes can boost finished‐goods margins by 5–10%, offsetting higher processing fees.
How should textile businesses evaluate overall profit margins when choosing between polyester and cotton?
Textile businesses should calculate total land‐to‐yard or resin‐to‐yard costs, including raw materials, processing (spinning, dyeing, finishing), energy, labor, waste, and sustainability fees. Cotton often yields higher headline margins (25–30%) but suffers from volatility, higher waste (5–8%), and lower lifetime product value. Polyester typically offers steadier margins (15–20%) on a lower‐cost base, with waste rates of 1–2%, longer shelf life, and strong performance premiums that drive brand loyalty. A comprehensive margin analysis must also consider inventory carrying, return rates, certification premiums, and end‐customer replacement cycles to accurately gauge ROI.
1. End‐to‐End Cost Comparison for a Standard Fabric Order
| Cost Component | Cotton Fabric (30s Jersey, 1 kg) | Polyester Fabric (150D Micro, 1 kg) |
|---|---|---|
| Raw Material (Fiber/Yarn Cost) | \$1.20–\$1.50 | \$1.20–\$1.50 |
| Spinning & Weaving | \$0.30–\$0.40 | \$0.25–\$0.35 |
| Dyeing & Finishing | \$0.43–\$0.65 | \$0.73–\$1.08 |
| Quality Control & Packaging | \$0.05–\$0.10 | \$0.07–\$0.12 |
| Logistics & FOB Overheads | \$0.10–\$0.15 | \$0.08–\$0.12 |
| Sustainability/Certification Fees | \$0.02–\$0.05 (BCI/Organic mix) | \$0.10–\$0.15 (rPET, GRS fees) |
| Total Cost per kg Fabric | \$2.10–\$2.65 | \$2.43–\$3.32 |
At the high end, polyester fabric can cost \$3.32/kg vs. cotton’s \$2.65/kg—a \$0.67 difference. However, polyester’s far lower waste rate (\~2% vs. 8%), higher shelf life, and lower return rates must be included in margin calculations.
2. Pricing Strategy & Gross Margin Calculation
Cotton Fabric Wholesale Price (1 kg equivalent)
- Typical FOB Price: \$4.00–\$4.50 (30s Jersey)
- Gross Margin:
- Low Cost Case: (Sell \$4.00 – Cost \$2.10) ÷ \$4.00 = 47.5%
- High Cost Case: (Sell \$4.50 – Cost \$2.65) ÷ \$4.50 = 41.1%
Polyester Fabric Wholesale Price (1 kg equivalent)
- Typical FOB Price: \$4.50–\$5.00 (150D Micro)
- Gross Margin:
- Low Cost Case: (Sell \$4.50 – Cost \$2.43) ÷ \$4.50 = 46.0%
- High Cost Case: (Sell \$5.00 – Cost \$3.32) ÷ \$5.00 = 33.6%
| Metric | Cotton (Low) | Cotton (High) | Polyester (Low) | Polyester (High) |
|---|---|---|---|---|
| Sell Price (USD/kg) | \$4.00 | \$4.50 | \$4.50 | \$5.00 |
| Total Cost (USD/kg) | \$2.10 | \$2.65 | \$2.43 | \$3.32 |
| Gross Margin (%) | 47.5% | 41.1% | 46.0% | 33.6% |
Under optimal cost conditions, cotton and polyester gross margins are similar (\~46–47%), but polyester has greater consistency. Under high‐cost scenarios (e.g., rPET fees, volatile feedstock), polyester’s margin can slip below cotton’s.
3. Net Margin Adjustments for Waste, Returns, and Inventory Carrying
Waste Rates (Impact on Net Cost)
- Cotton Waste (8%):
- Effective cost increases from \$2.65/kg to \$2.65/kg ÷ 0.92 = \$2.88/kg.
- Polyester Waste (2%):
- Effective cost increases from \$3.32/kg to \$3.32/kg ÷ 0.98 = \$3.39/kg.
Return Rates (Impact on Revenue)
- Cotton Return Rate (6%):
- Effective selling realized revenue: \$4.50 × 0.94 = \$4.23/kg.
- Polyester Return Rate (2%):
- Effective selling realized revenue: \$5.00 × 0.98 = \$4.90/kg.
| Adjusted Margin Factor | Cotton (High Cost) | Polyester (High Cost) |
|---|---|---|
| Adjusted Cost (Waste) | \$2.88/kg | \$3.39/kg |
| Adjusted Revenue (Returns) | \$4.23/kg | \$4.90/kg |
| Adjusted Net Margin (USD/kg) | \$1.35 (≈31.9%) | \$1.51 (≈30.8%) |
When factoring in waste and returns, polyester’s high‐cost scenario (rPET & complex finishing) ends up with 30.8% net margin versus cotton’s 31.9%. The difference is minimal—but polyester’s higher consistency and lower square‐foot inventory requirements can tilt ROI further in its favor.
4. Inventory Carrying & Working Capital Implications
| Inventory Consideration | Cotton | Polyester |
|---|---|---|
| Typical Inventory Days | 60–90 days | 30–45 days |
| Carrying Cost (% of Inventory) | 15–20% annual | 10–15% annual |
| Average Inventory Value (USD/kg) | \$4.50 | \$5.00 |
| Carrying Cost Impact (USD/kg) | \$0.123–\$0.247 (for 60–90 days) | \$0.041–\$0.057 (for 30–45 days) |
A cotton fabric with \$4.50/kg inventory held 75 days costs \$0.37/kg in carrying alone. Polyester at \$5.00/kg held 37 days costs \$0.075/kg—saving \~\$0.30/kg of margin dollars per kg in financial carrying cost.
5. Margin Sensitivity to Feedstock and Cotton Spot Price Shocks
Cotton Spot Price Shock (+20%)
- Raw Lint Cost: \$2.00 → \$2.40/kg.
- New Total Cost (High Scenario): \$2.65 + (0.20 × \$1.20) = \$2.89/kg (assuming spinning cost constant).
- New Adjusted Cost (Waste + Returns): \$2.89 ÷ 0.92 = \$3.14/kg.
- Adjusted Revenue (unchanged): \$4.23/kg.
- New Net Margin: \$4.23 – \$3.14 = \$1.09 (≈25.8%).
Polyester Feedstock Shock (+10%)
- Feedstock Cost: \$1.50 → \$1.65/kg.
- New Total Cost (High Scenario): \$3.32 + (0.10 × \$1.20) = \$3.44/kg.
- New Adjusted Cost (Waste + Returns): \$3.44 ÷ 0.98 = \$3.51/kg.
- Adjusted Revenue (unchanged): \$4.90/kg.
- New Net Margin: \$4.90 – \$3.51 = \$1.39 (≈28.4%).
| Shock Scenario | Cotton Net Margin (Post‐Shock) | Polyester Net Margin (Post‐Shock) |
|---|---|---|
| Raw Material (+20%) | 25.8% | N/A |
| Feedstock (+10%) | N/A | 28.4% |
In extreme cotton price spikes, cotton’s net margin can plummet from \~31.9% to \~25.8%, whereas a moderate 10% polyester feedstock increase only reduces margin from \~30.8% to \~28.4%. Polyester offers more robust margin resilience to input volatility.
6. End‐Product Price Elasticity & Volume Considerations
Price Elasticity Estimates (2023 Survey of 2,000 Retail Buyers):
- Cotton Apparel: Elasticity coefficient \~−1.6 (10% price increase → 16% drop in quantity demanded).
- Polyester/Apparel: Elasticity coefficient \~−1.2 (10% price increase → 12% drop in quantity demanded).
Volume Thresholds for Economies of Scale (Example Yarn Orders):
- Cotton Yarn Lifts (per 10 T order): \$0.05/kg discount on base cost.
- Polyester Yarn Lifts (per 30 T order): \$0.07/kg discount.
| Dimension | Cotton | Polyester |
|---|---|---|
| Demand Sensitivity | High (luxury/casual wear) | Moderate (active/performance wear) |
| Volume Discount Threshold | 10 T per order | 30 T per order |
| Typical Batch Order Size | 2–5 T (small brands) | 5–10 T (large brands, mills) |
| Price Change Impact | Greater drop in demand with price hikes | Loan demand drop when price hikes occur |
Cotton’s greater price sensitivity can undermine margin if brands attempt to pass input cost increases downstream. Polyester’s more inelastic demand allows sponsors to raise prices with less decline in volume, protecting ROI.
7. Critical Perspectives on Profit Margin Scenarios
“Luxury Cotton” Versus “Performance Polyester” Niches
- Cotton Luxury Brands: Achieve 50–60% gross margin due to premium positioning (limited production, artisanal appeal).
- Polyester Performance Brands: Often operate at 25–35% margin but enjoy higher volume, rapid turnover, and supply consistency.
- ROI Trade‐Off: Higher margins on cotton can be offset by episodic freight spikes (airfreight needed when cotton delays happen), returns, and inventory obsolescence.
Blended Fabric Strategies
- Polyester‐Cotton (PC) Blends (65/35, 50/50):
- Combine cotton’s comfort with polyester’s durability, often priced \~\$0.20–\$0.30/m above 100% polyester but \~\$0.60–\$0.80/m below 100% cotton.
- Net Margin for 65/35 PC Blend: Intermediate—color uniformity challenges add \$0.05/kg to dyeing, but waste drops to 4–5%.
| Blend Type | Cost (USD/kg) | Selling Price (USD/kg) | Net Margin (%) | Key Consideration |
|---|---|---|---|---|
| 100% Cotton | \$2.65 | \$4.50 | 31.1% | High volatility, higher waste |
| 65/35 Polyester/Cotton Blend | \$2.50 | \$4.30 | 41.9% | Lower cotton volatility, reduced finish complexity |
| 100% Polyester | \$3.32 | \$5.00 | 33.6% | Stable inputs, higher finish complexity costs |
A 65/35 PC blend can yield a \~42% net margin—exceeding both pure cotton (31.1%) and polyester (33.6%)—if managed carefully, balancing input costs and processing complexities.
8. Final ROI Considerations & Risk Mitigation
Currency Fluctuation Risk
- Cotton transactions often denominated in USD; mills with local currency revenue face forex risk.
- Polyester feedstock firms typically have USD hedges and pass‐through contracts that reduce currency exposure.
Inventory Obsolescence & Fashion Cycles
- Cotton seasonality means fashion trends can shift during transit from harvest → mill → garment → retail, leading to markdowns.
- Polyester’s year‐round production aligns better with fast‐fashion cycles, minimizing obsolescence.
Contingency Cost Buffers
- Successful cotton‐focused mills may maintain a 10–15% contingency buffer in margins to absorb sudden lint price hikes.
- Polyester mills often operate on a lean 5–8% buffer, relying on feedstock hedging and long‐term contracts to manage price risk.
While cotton can offer high gross margins in premium segments, its greater input volatility, higher waste, and demand elasticity can erode ROI over time. Polyester’s steadier input costs, lower waste, performance premiums, and more flexible inventory management often produce more resilient profit margins, particularly for high‐volume, fast‐turnover lines.
Ready to optimize your fabric sourcing and maximize ROI?
In this deep dive, we examined the myriad factors influencing ROI when choosing between cotton and polyester: from raw material costs, supply‐chain stability, and production efficiency to performance characteristics, market trends, sustainability implications, and finishing‐dyeing expenses. Both fibers present enticing advantages—cotton’s comfort and premium positioning versus polyester’s durability, consistency, and scalability—but for most high‐volume textile businesses, polyester (especially recycled polyester) often yields a more stable, predictable, and ultimately higher ROI across the product lifecycle.
Whether you’re balancing the allure of organic cotton for a luxury line or integrating rPET to showcase sustainable credentials, the choice hinges on analyzing total costs (from fiber to finished yard), projected margins, and market positioning. For brands and manufacturers seeking a balanced approach, polyester‐cotton blends can optimize both cost and performance, delivering gross margins above those of pure‐play fibers.
SzoneierFabrics offers comprehensive, end‐to‐end polyester and cotton fabric solutions tailored to your exact needs:
- Competitive Pricing: Leveraging our long‐term partnerships with feedstock suppliers to secure stable, low‐cost fiber.
- Custom Dye & Finish Expertise: From high‐temperature disperse dyeing for polyester to precision reactive dyeing for cotton, we ensure consistent color and durable performance finishes.
- Low MOQ & Rapid Sampling: With minimum orders as low as 500 meters and 5–7 day prototyping, we help you iterate quickly and keep inventory costs lean.
- Sustainability Options: Choose from 100% organic cotton, Better Cotton Initiative (BCI) blends, virgin polyester, or 30–50% rPET options to meet your brand’s environmental goals.
- Quality Assurance: ISO 9001 and OEKO-TEX® certified facilities ensure that every batch meets stringent global quality and safety standards.
To discuss your next project, request a detailed quote, or order samples, please contact SzoneierFabrics, Let SzoneierFabrics help you strike the perfect balance between cost, performance, and sustainability—delivering fabrics that unlock the best ROI for your textile business.